

AFRICA AGRICULTURE STATUS REPORT 2016
AASR-report_2016-1
AASR-report_2016-1

You also want an ePaper? Increase the reach of your titles
YUMPU automatically turns print PDFs into web optimized ePapers that Google loves.
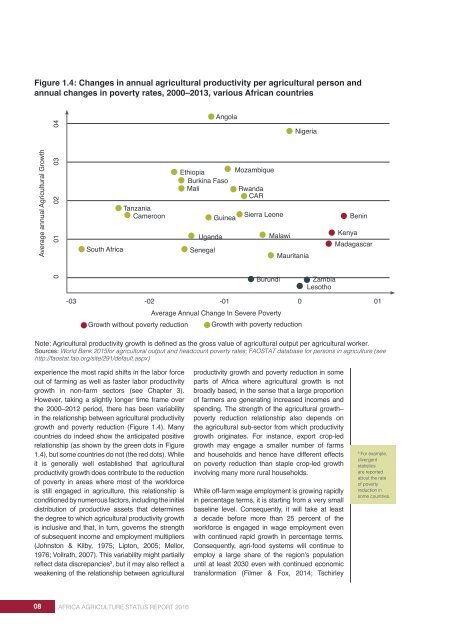
Figure 1.4: Changes in annual agricultural productivity per agricultural person and<br />
annual changes in poverty rates, 2000–2013, various African countries<br />
Angola<br />
Average annual Agricultural Growth<br />
02 03 04<br />
0 01<br />
South Africa<br />
Tanzania<br />
Cameroon<br />
Ethiopia<br />
Burkina Faso<br />
Mali<br />
Uganda<br />
Senegal<br />
Guinea<br />
Mozambique<br />
Rwanda<br />
CAR<br />
Sierra Leone<br />
Malawi<br />
Burundi<br />
Nigeria<br />
Mauritania<br />
Zambia<br />
Lesotho<br />
Benin<br />
Kenya<br />
Madagascar<br />
-03<br />
-02 -01 0 01<br />
Average Annual Change In Severe Poverty<br />
Growth without poverty reduction Growth with poverty reduction<br />
Note: Agricultural productivity growth is defined as the gross value of agricultural output per agricultural worker.<br />
Sources: World Bank 2015for agricultural output and headcount poverty rates; FAOSTAT database for persons in agriculture (see<br />
http://faostat.fao.org/site/291/default.aspx)<br />
experience the most rapid shifts in the labor force<br />
out of farming as well as faster labor productivity<br />
growth in non-farm sectors (see Chapter 3).<br />
However, taking a slightly longer time frame over<br />
the 2000–2012 period, there has been variability<br />
in the relationship between agricultural productivity<br />
growth and poverty reduction (Figure 1.4). Many<br />
countries do indeed show the anticipated positive<br />
relationship (as shown by the green dots in Figure<br />
1.4), but some countries do not (the red dots). While<br />
it is generally well established that agricultural<br />
productivity growth does contribute to the reduction<br />
of poverty in areas where most of the workforce<br />
is still engaged in agriculture, this relationship is<br />
conditioned by numerous factors, including the initial<br />
distribution of productive assets that determines<br />
the degree to which agricultural productivity growth<br />
is inclusive and that, in turn, governs the strength<br />
of subsequent income and employment multipliers<br />
(Johnston & Kilby, 1975; Lipton, 2005; Mellor,<br />
1976; Vollrath, 2007). This variability might partially<br />
reflect data discrepancies 3 , but it may also reflect a<br />
weakening of the relationship between agricultural<br />
productivity growth and poverty reduction in some<br />
parts of Africa where agricultural growth is not<br />
broadly based, in the sense that a large proportion<br />
of farmers are generating increased incomes and<br />
spending. The strength of the agricultural growth–<br />
poverty reduction relationship also depends on<br />
the agricultural sub-sector from which productivity<br />
growth originates. For instance, export crop-led<br />
growth may engage a smaller number of farms<br />
and households and hence have different effects<br />
on poverty reduction than staple crop-led growth<br />
involving many more rural households.<br />
While off-farm wage employment is growing rapidly<br />
in percentage terms, it is starting from a very small<br />
baseline level. Consequently, it will take at least<br />
a decade before more than 25 percent of the<br />
workforce is engaged in wage employment even<br />
with continued rapid growth in percentage terms.<br />
Consequently, agri-food systems will continue to<br />
employ a large share of the region’s population<br />
until at least 2030 even with continued economic<br />
transformation (Filmer & Fox, 2014; Tschirley<br />
3<br />
For example,<br />
divergent<br />
statistics<br />
are reported<br />
about the rate<br />
of poverty<br />
reduction in<br />
some countries.<br />
08 <strong>AFRICA</strong> <strong>AGRICULTURE</strong> <strong>STATUS</strong> <strong>REPORT</strong> <strong>2016</strong>