

AFRICA AGRICULTURE STATUS REPORT 2016
AASR-report_2016-1
AASR-report_2016-1

Create successful ePaper yourself
Turn your PDF publications into a flip-book with our unique Google optimized e-Paper software.
agricultural potential, alternative (or non-agricultural) sources<br />
of growth, and income level (Benin et al., Kennedy, Lambert, &<br />
McBride, 2010). The categories reflect the notion that different<br />
countries, depending on their resource endowments and stage<br />
of development, are on different trajectories toward achieving<br />
their development objectives (Diao, Hazell, Resnick, & Thurlow,<br />
2007) 2 . They include: low-income countries with less favorable<br />
agricultural conditions, low-income countries with more favorable<br />
agricultural conditions, low-income countries with mineral-rich<br />
economies, and middle-income countries. Three sub-periods are<br />
considered: 1995–2003, representing the baseline period; 2003–<br />
2008, representing the periods up to the initial CAADP end date<br />
of 2008; and 2008–2014, representing the period up to the year<br />
when the Malabo Declaration was made.<br />
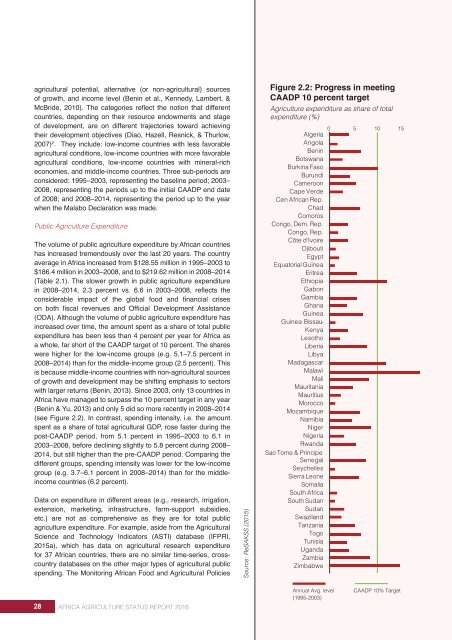
Figure 2.2: Progress in meeting<br />
CAADP 10 percent target<br />
Agriculture expenditure as share of total<br />
expenditure (%)<br />
Public Agriculture Expenditure<br />
The volume of public agriculture expenditure by African countries<br />
has increased tremendously over the last 20 years. The country<br />
average in Africa increased from $128.55 million in 1995–2003 to<br />
$186.4 million in 2003–2008, and to $219.62 million in 2008–2014<br />
(Table 2.1). The slower growth in public agriculture expenditure<br />
in 2008–2014, 2.3 percent vs. 6.6 in 2003–2008, reflects the<br />
considerable impact of the global food and financial crises<br />
on both fiscal revenues and Official Development Assistance<br />
(ODA). Although the volume of public agriculture expenditure has<br />
increased over time, the amount spent as a share of total public<br />
expenditure has been less than 4 percent per year for Africa as<br />
a whole, far short of the CAADP target of 10 percent. The shares<br />
were higher for the low-income groups (e.g. 5.1–7.5 percent in<br />
2008–2014) than for the middle-income group (2.5 percent). This<br />
is because middle-income countries with non-agricultural sources<br />
of growth and development may be shifting emphasis to sectors<br />
with larger returns (Benin, 2013). Since 2003, only 13 countries in<br />
Africa have managed to surpass the 10 percent target in any year<br />
(Benin & Yu, 2013) and only 5 did so more recently in 2008–2014<br />
(see Figure 2.2). In contrast, spending intensity, i.e. the amount<br />
spent as a share of total agricultural GDP, rose faster during the<br />
post-CAADP period, from 5.1 percent in 1995–2003 to 6.1 in<br />
2003–2008, before declining slightly to 5.8 percent during 2008–<br />
2014, but still higher than the pre-CAADP period. Comparing the<br />
different groups, spending intensity was lower for the low-income<br />
group (e.g. 3.7–6.1 percent in 2008–2014) than for the middleincome<br />
countries (6.2 percent).<br />
Data on expenditure in different areas (e.g., research, irrigation,<br />
extension, marketing, infrastructure, farm-support subsidies,<br />
etc.) are not as comprehensive as they are for total public<br />
agriculture expenditure. For example, aside from the Agricultural<br />
Science and Technology Indicators (ASTI) database (IFPRI,<br />
2015a), which has data on agricultural research expenditure<br />
for 37 African countries, there are no similar time-series, crosscountry<br />
databases on the other major types of agricultural public<br />
spending. The Monitoring African Food and Agricultural Policies<br />
Source: ReSAKSS (2015)<br />
28 <strong>AFRICA</strong> <strong>AGRICULTURE</strong> <strong>STATUS</strong> <strong>REPORT</strong> <strong>2016</strong><br />
Annual Avg. level<br />
(1995-2003)<br />
CAADP 10% Target