

AFRICA AGRICULTURE STATUS REPORT 2016
AASR-report_2016-1
AASR-report_2016-1

You also want an ePaper? Increase the reach of your titles
YUMPU automatically turns print PDFs into web optimized ePapers that Google loves.
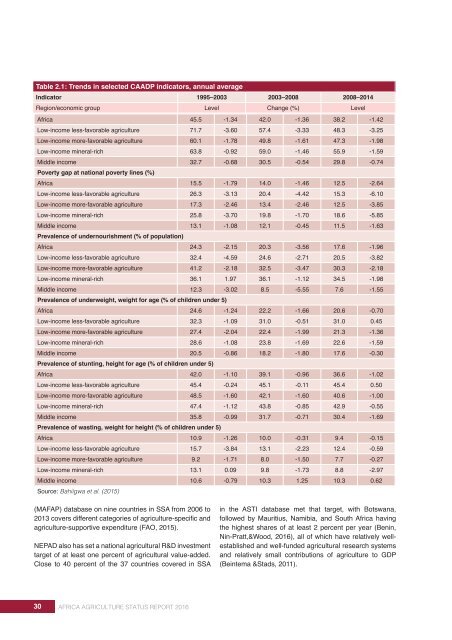
Table 2.1: Trends in selected CAADP indicators, annual average<br />
Indicator 1995–2003 2003–2008 2008–2014<br />
Region/economic Poverty headcount group ratio at $1.25/day (PPP, % of population) Level Change (%) Level<br />
Africa 45.5 -1.34 42.0 -1.36 38.2 -1.42<br />
Low-income less-favorable agriculture 71.7 -3.60 57.4 -3.33 48.3 -3.25<br />
Low-income more-favorable agriculture 60.1 -1.78 49.8 -1.61 47.3 -1.98<br />
Low-income mineral-rich 63.8 -0.92 59.0 -1.46 55.9 -1.59<br />
Middle income 32.7 -0.68 30.5 -0.54 29.8 -0.74<br />
Poverty gap at national poverty lines (%)<br />
Africa 15.5 -1.79 14.0 -1.46 12.5 -2.64<br />
Low-income less-favorable agriculture 26.3 -3.13 20.4 -4.42 15.3 -6.10<br />
Low-income more-favorable agriculture 17.3 -2.46 13.4 -2.46 12.5 -3.85<br />
Low-income mineral-rich 25.8 -3.70 19.8 -1.70 18.6 -5.85<br />
Middle income 13.1 -1.08 12.1 -0.45 11.5 -1.63<br />
Prevalence of undernourishment (% of population)<br />
Africa 24.3 -2.15 20.3 -3.56 17.6 -1.96<br />
Low-income less-favorable agriculture 32.4 -4.59 24.6 -2.71 20.5 -3.82<br />
Low-income more-favorable agriculture 41.2 -2.18 32.5 -3.47 30.3 -2.18<br />
Low-income mineral-rich 36.1 1.97 36.1 -1.12 34.5 -1.98<br />
Middle income 12.3 -3.02 8.5 -5.55 7.6 -1.55<br />
Prevalence of underweight, weight for age (% of children under 5)<br />
Africa 24.6 -1.24 22.2 -1.66 20.6 -0.70<br />
Low-income less-favorable agriculture 32.3 -1.09 31.0 -0.51 31.0 0.45<br />
Low-income more-favorable agriculture 27.4 -2.04 22.4 -1.99 21.3 -1.36<br />
Low-income mineral-rich 28.6 -1.08 23.8 -1.69 22.6 -1.59<br />
Middle income 20.5 -0.86 18.2 -1.80 17.6 -0.30<br />
Prevalence of stunting, height for age (% of children under 5)<br />
Africa 42.0 -1.10 39.1 -0.96 36.6 -1.02<br />
Low-income less-favorable agriculture 45.4 -0.24 45.1 -0.11 45.4 0.50<br />
Low-income more-favorable agriculture 48.5 -1.60 42.1 -1.60 40.6 -1.00<br />
Low-income mineral-rich 47.4 -1.12 43.8 -0.85 42.9 -0.55<br />
Middle income 35.8 -0.99 31.7 -0.71 30.4 -1.69<br />
Prevalence of wasting, weight for height (% of children under 5)<br />
Africa 10.9 -1.26 10.0 -0.31 9.4 -0.15<br />
Low-income less-favorable agriculture 15.7 -3.84 13.1 -2.23 12.4 -0.59<br />
Low-income more-favorable agriculture 9.2 -1.71 8.0 -1.50 7.7 -0.27<br />
Low-income mineral-rich 13.1 0.09 9.8 -1.73 8.8 -2.97<br />
Middle income 10.6 -0.79 10.3 1.25 10.3 0.62<br />
Source: Bahiigwa et al. (2015)<br />
(MAFAP) database on nine countries in SSA from 2006 to<br />
2013 covers different categories of agriculture-specific and<br />
agriculture-supportive expenditure (FAO, 2015).<br />
NEPAD also has set a national agricultural R&D investment<br />
target of at least one percent of agricultural value-added.<br />
Close to 40 percent of the 37 countries covered in SSA<br />
in the ASTI database met that target, with Botswana,<br />
followed by Mauritius, Namibia, and South Africa having<br />
the highest shares of at least 2 percent per year (Benin,<br />
Nin-Pratt,&Wood, <strong>2016</strong>), all of which have relatively wellestablished<br />
and well-funded agricultural research systems<br />
and relatively small contributions of agriculture to GDP<br />
(Beintema &Stads, 2011).<br />
30 <strong>AFRICA</strong> <strong>AGRICULTURE</strong> <strong>STATUS</strong> <strong>REPORT</strong> <strong>2016</strong>