

AFRICA AGRICULTURE STATUS REPORT 2016
AASR-report_2016-1
AASR-report_2016-1

You also want an ePaper? Increase the reach of your titles
YUMPU automatically turns print PDFs into web optimized ePapers that Google loves.
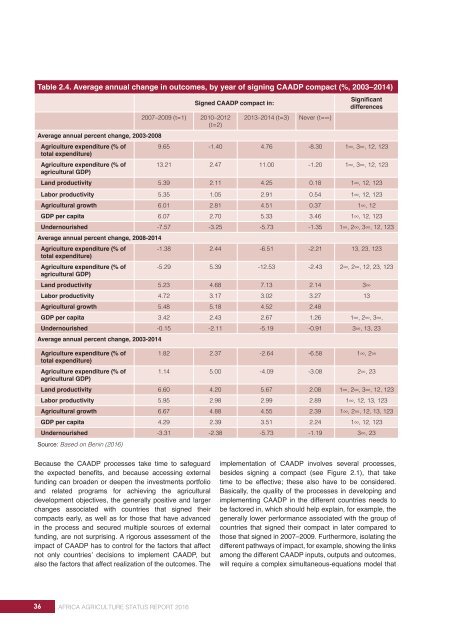
Table 2.4. Average annual change in outcomes, by year of signing CAADP compact (%, 2003–2014)<br />
Average annual percent change, 2003-2008<br />
Agriculture expenditure (% of<br />
total expenditure)<br />
Agriculture expenditure (% of<br />
agricultural GDP)<br />
2007–2009 (t=1) 2010–2012<br />
(t=2)<br />
Signed CAADP compact in:<br />
2013–2014 (t=3) Never (t=∞)<br />
Significant<br />
differences<br />
9.65 -1.40 4.76 -8.30 1∞, 3∞, 12, 123<br />
13.21 2.47 11.00 -1.20 1∞, 3∞, 12, 123<br />
Land productivity 5.39 2.11 4.25 0.18 1∞, 12, 123<br />
Labor productivity 5.35 1.05 2.91 0.54 1∞, 12, 123<br />
Agricultural growth 6.01 2.81 4.51 0.37 1∞, 12<br />
GDP per capita 6.07 2.70 5.33 3.46 1∞, 12, 123<br />
Undernourished -7.57 -3.25 -5.73 -1.35 1∞, 2∞, 3∞, 12, 123<br />
Average annual percent change, 2008-2014<br />
Agriculture expenditure (% of<br />
total expenditure)<br />
Agriculture expenditure (% of<br />
agricultural GDP)<br />
-1.38 2.44 -6.51 -2.21 13, 23, 123<br />
-5.29 5.39 -12.53 -2.43 2∞, 2∞, 12, 23, 123<br />
Land productivity 5.23 4.68 7.13 2.14 3∞<br />
Labor productivity 4.72 3.17 3.02 3.27 13<br />
Agricultural growth 5.48 5.18 4.52 2.48<br />
GDP per capita 3.42 2.43 2.67 1.26 1∞, 2∞, 3∞,<br />
Undernourished -0.15 -2.11 -5.19 -0.91 3∞, 13, 23<br />
Average annual percent change, 2003-2014<br />
Agriculture expenditure (% of<br />
total expenditure)<br />
Agriculture expenditure (% of<br />
agricultural GDP)<br />
1.82 2.37 -2.64 -6.58 1∞, 2∞<br />
1.14 5.00 -4.09 -3.08 2∞, 23<br />
Land productivity 6.60 4.20 5.67 2.08 1∞, 2∞, 3∞, 12, 123<br />
Labor productivity 5.95 2.98 2.99 2.89 1∞, 12, 13, 123<br />
Agricultural growth 6.67 4.88 4.55 2.39 1∞, 2∞, 12, 13, 123<br />
GDP per capita 4.29 2.39 3.51 2.24 1∞, 12, 123<br />
Undernourished -3.31 -2.38 -5.73 -1.19 3∞, 23<br />
Source: Based on Benin (<strong>2016</strong>)<br />
Because the CAADP processes take time to safeguard<br />
the expected benefits, and because accessing external<br />
funding can broaden or deepen the investments portfolio<br />
and related programs for achieving the agricultural<br />
development objectives, the generally positive and larger<br />
changes associated with countries that signed their<br />
compacts early, as well as for those that have advanced<br />
in the process and secured multiple sources of external<br />
funding, are not surprising. A rigorous assessment of the<br />
impact of CAADP has to control for the factors that affect<br />
not only countries’ decisions to implement CAADP, but<br />
also the factors that affect realization of the outcomes. The<br />
implementation of CAADP involves several processes,<br />
besides signing a compact (see Figure 2.1), that take<br />
time to be effective; these also have to be considered.<br />
Basically, the quality of the processes in developing and<br />
implementing CAADP in the different countries needs to<br />
be factored in, which should help explain, for example, the<br />
generally lower performance associated with the group of<br />
countries that signed their compact in later compared to<br />
those that signed in 2007–2009. Furthermore, isolating the<br />
different pathways of impact, for example, showing the links<br />
among the different CAADP inputs, outputs and outcomes,<br />
will require a complex simultaneous-equations model that<br />
36 <strong>AFRICA</strong> <strong>AGRICULTURE</strong> <strong>STATUS</strong> <strong>REPORT</strong> <strong>2016</strong>