

AFRICA AGRICULTURE STATUS REPORT 2016
AASR-report_2016-1
AASR-report_2016-1

Create successful ePaper yourself
Turn your PDF publications into a flip-book with our unique Google optimized e-Paper software.
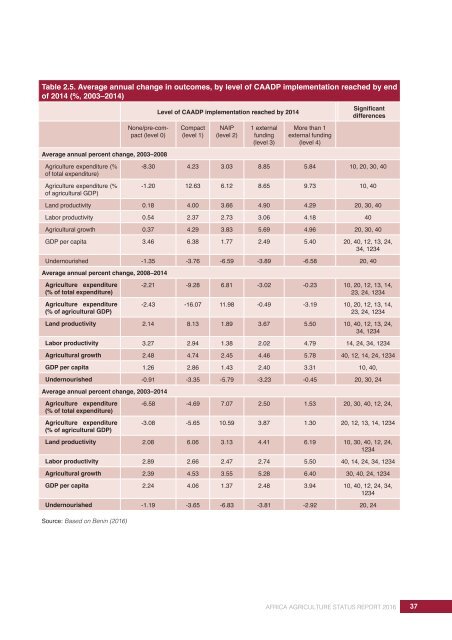
Table 2.5. Average annual change in outcomes, by level of CAADP implementation reached by end<br />
of 2014 (%, 2003–2014)<br />
Level of CAADP implementation reached by 2014<br />
Significant<br />
differences<br />
None/pre-compact<br />
(level 0)<br />
Compact<br />
(level 1)<br />
NAIP<br />
(level 2)<br />
1 external<br />
funding<br />
(level 3)<br />
More than 1<br />
external funding<br />
(level 4)<br />
Average annual percent change, 2003–2008<br />
Agriculture expenditure (%<br />
of total expenditure)<br />
Agriculture expenditure (%<br />
of agricultural GDP)<br />
-8.30 4.23 3.03 8.85 5.84 10, 20, 30, 40<br />
-1.20 12.63 6.12 8.65 9.73 10, 40<br />
Land productivity 0.18 4.00 3.66 4.90 4.29 20, 30, 40<br />
Labor productivity 0.54 2.37 2.73 3.06 4.18 40<br />
Agricultural growth 0.37 4.29 3.83 5.69 4.96 20, 30, 40<br />
GDP per capita 3.46 6.38 1.77 2.49 5.40 20, 40, 12, 13, 24,<br />
34, 1234<br />
Undernourished -1.35 -3.76 -6.59 -3.89 -6.58 20, 40<br />
Average annual percent change, 2008–2014<br />
Agriculture expenditure<br />
(% of total expenditure)<br />
Agriculture expenditure<br />
(% of agricultural GDP)<br />
-2.21 -9.28 6.81 -3.02 -0.23 10, 20, 12, 13, 14,<br />
23, 24, 1234<br />
-2.43 -16.07 11.98 -0.49 -3.19 10, 20, 12, 13, 14,<br />
23, 24, 1234<br />
Land productivity 2.14 8.13 1.89 3.67 5.50 10, 40, 12, 13, 24,<br />
34, 1234<br />
Labor productivity 3.27 2.94 1.38 2.02 4.79 14, 24, 34, 1234<br />
Agricultural growth 2.48 4.74 2.45 4.46 5.78 40, 12, 14, 24, 1234<br />
GDP per capita 1.26 2.86 1.43 2.40 3.31 10, 40,<br />
Undernourished -0.91 -3.35 -5.79 -3.23 -0.45 20, 30, 24<br />
Average annual percent change, 2003–2014<br />
Agriculture expenditure<br />
(% of total expenditure)<br />
Agriculture expenditure<br />
(% of agricultural GDP)<br />
-6.58 -4.69 7.07 2.50 1.53 20, 30, 40, 12, 24,<br />
-3.08 -5.65 10.59 3.87 1.30 20, 12, 13, 14, 1234<br />
Land productivity 2.08 6.06 3.13 4.41 6.19 10, 30, 40, 12, 24,<br />
1234<br />
Labor productivity 2.89 2.66 2.47 2.74 5.50 40, 14, 24, 34, 1234<br />
Agricultural growth 2.39 4.53 3.55 5.28 6.40 30, 40, 24, 1234<br />
GDP per capita 2.24 4.06 1.37 2.48 3.94 10, 40, 12, 24, 34,<br />
1234<br />
Undernourished -1.19 -3.65 -6.83 -3.81 -2.92 20, 24<br />
Source: Based on Benin (<strong>2016</strong>)<br />
<strong>AFRICA</strong> <strong>AGRICULTURE</strong> <strong>STATUS</strong> <strong>REPORT</strong> <strong>2016</strong><br />
37