Cereal Yield (kg per hectare) Country Name 2001 2002 2003 2004 2005 2006 2007 2008 2009 2010 2011 2012 2013 2014 Angola 585 627 646 492 583 446 464 653 571 629 662 552 815 889 Benin 1,069 945 1,149 1,147 1,136 1,125 1,014 1,248 1,271 1,201 1,518 1,373 1,399 1,460 Botswana 554 359 1,214 274 443 372 639 361 359 374 452 367 218 398 Burkina Faso 968 943 996 941 1,127 1,204 936 1,040 1,002 1,063 995 1,203 1,157 1,226 Burundi 1,284 1,309 1,262 1,328 1,344 1,277 1,345 1,281 1,296 1,299 1,309 1,102 1,176 1,330 Cabo Verde 637 149 379 385 243 141 110 337 231 220 178 196 182 36 Cameroon 1,709 1,683 1,620 1,563 1,727 1,811 1,676 1,678 1,765 1,669 1,681 1,597 1,652 1,623 Central African Republic 1,011 1,048 1,019 991 962 860 951 947 948 1,447 1,522 1,684 1,716 1,649 Chad 635 671 791 671 762 750 763 812 830 843 772 856 1,008 941 Comoros 1,279 1,169 1,197 1,255 1,285 1,322 1,380 1,291 1,403 1,418 1,411 1,390 1,443 1,447 Congo, Dem. Rep. 787 772 772 772 772 772 772 772 772 772 744 770 767 763 Congo, Rep. 777 778 814 822 752 778 766 771 791 780 814 848 889 910 Cote d’Ivoire 1,720 1,751 1,827 1,854 1,836 1,918 1,569 1,735 1,712 2,270 1,882 2,766 3,125 3,254 Eritrea 637 158 261 275 758 799 939 252 500 536 578 608 602 626 Ethiopia 1,198 1,354 1,123 1,163 1,361 1,563 1,439 1,450 1,683 1,833 1,962 2,047 2,193 2,325 Gabon 1,538 1,442 1,588 1,604 1,600 1,584 1,666 1,603 1,658 1,687 1,698 1,685 1,691 1,688 Gambia, The 1,283 960 1,198 1,171 1,040 1,026 800 977 1,049 1,127 869 910 959 745 Ghana 1,186 1,349 1,396 1,373 1,432 1,335 1,317 1,598 1,660 1,814 1,594 1,768 1,689 1,703 Guinea 1,483 1,487 1,485 1,491 1,496 1,502 1,514 1,464 1,469 1,459 1,532 1,513 1,508 1,543 Guinea-Bissau 1,005 1,067 1,099 1,275 1,534 1,675 1,346 1,487 1,627 1,618 1,367 1,481 1,330 1,262 Kenya 1,640 1,489 1,594 1,806 1,646 1,647 1,773 1,418 1,243 1,710 1,515 1,745 1,662 1,628 Lesotho 995 737 611 597 690 523 436 390 421 909 664 240 811 755 Liberia 1,115 917 833 917 1,290 1,262 1,449 1,553 1,184 1,179 1,183 1,164 1,174 1,077 <strong>AFRICA</strong> <strong>AGRICULTURE</strong> <strong>STATUS</strong> <strong>REPORT</strong> <strong>2016</strong> 267
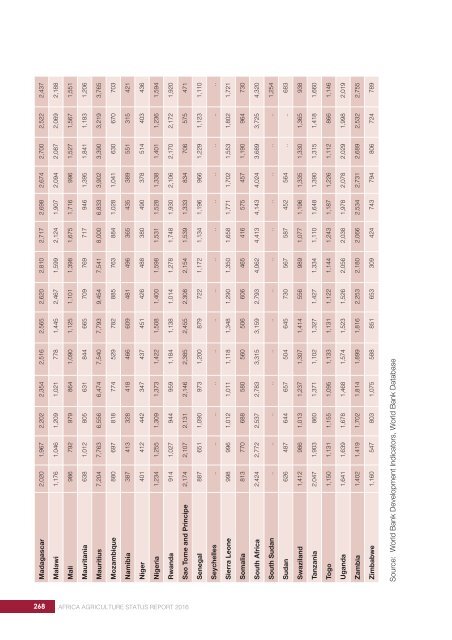
Madagascar 2,020 1,967 2,202 2,354 2,516 2,565 2,620 2,810 2,717 2,698 2,674 2,700 2,522 2,437 Malawi 1,176 1,046 1,209 1,021 778 1,445 2,467 1,599 2,124 1,907 2,094 2,087 2,069 2,188 Mali 986 792 979 864 1,090 1,125 1,101 1,398 1,675 1,716 996 1,527 1,567 1,551 Mauritania 638 1,012 805 631 844 665 709 769 717 946 1,395 1,841 1,183 1,206 Mauritius 7,204 7,763 6,556 6,474 7,540 7,793 9,454 7,541 8,000 6,833 3,902 3,390 3,219 3,765 Mozambique 880 697 818 774 529 782 885 763 884 1,028 1,041 630 670 703 Namibia 387 413 328 418 466 609 481 496 365 435 389 551 315 421 Niger 401 412 442 347 437 451 426 488 380 490 378 514 403 436 Nigeria 1,234 1,255 1,309 1,373 1,422 1,508 1,400 1,598 1,531 1,528 1,338 1,401 1,236 1,594 Rwanda 914 1,027 944 959 1,184 1,138 1,014 1,278 1,748 1,930 2,106 2,170 2,172 1,920 Sao Tome and Principe 2,174 2,107 2,131 2,146 2,385 2,455 2,308 2,154 1,539 1,333 834 706 575 471 Senegal 887 651 1,090 973 1,200 879 722 1,172 1,134 1,196 966 1,229 1,123 1,110 Seychelles .. .. .. .. .. .. .. .. .. .. .. .. .. .. Sierra Leone 998 996 1,012 1,011 1,118 1,348 1,290 1,350 1,658 1,771 1,702 1,553 1,802 1,721 Somalia 813 770 688 580 560 506 606 465 416 575 457 1,190 964 730 South Africa 2,424 2,772 2,537 2,783 3,315 3,159 2,793 4,062 4,413 4,143 4,024 3,689 3,725 4,320 South Sudan .. .. .. .. .. .. .. .. .. .. .. .. .. 1,254 Sudan 626 487 644 657 504 645 730 567 587 452 564 .. .. 683 Swaziland 1,412 986 1,013 1,237 1,307 1,414 556 989 1,077 1,196 1,335 1,330 1,365 938 Tanzania 2,047 1,903 860 1,371 1,102 1,327 1,427 1,334 1,110 1,648 1,390 1,315 1,418 1,660 Togo 1,150 1,131 1,155 1,095 1,133 1,131 1,122 1,144 1,243 1,187 1,226 1,112 866 1,146 Uganda 1,641 1,639 1,678 1,468 1,574 1,523 1,526 2,056 2,038 1,978 2,078 2,029 1,998 2,019 Zambia 1,402 1,419 1,702 1,814 1,899 1,816 2,253 2,180 2,066 2,534 2,731 2,689 2,532 2,755 Zimbabwe 1,160 547 803 1,075 588 851 653 309 424 743 794 806 724 789 Source: World Bank Development Indicators, World Bank Database 268 <strong>AFRICA</strong> <strong>AGRICULTURE</strong> <strong>STATUS</strong> <strong>REPORT</strong> <strong>2016</strong>
- Page 2:
AFRICA AGRICULTURE STATUS REPORT 20
- Page 5 and 6:
FOREWORD Over the last decade, mill
- Page 7 and 8:
ACKNOWLEDGEMENTS The Africa Agricul
- Page 9 and 10:
ACRONYMS Africa Lead AAS AASR AATIF
- Page 11 and 12:
FMARD FSN FTF GACSA GAFSP GAIN GART
- Page 13 and 14:
SAKSS SBCC SCARDA SCM SDG SDI SI SM
- Page 15 and 16:
Introduction For decades, observers
- Page 17 and 18:
and changing food diets associated
- Page 19 and 20:
Table 1.2: Population growth of sel
- Page 21 and 22:
Figure 1.4: Changes in annual agric
- Page 23 and 24:
already occurring (Headey & Jayne,
- Page 25 and 26:
lease of customary land without the
- Page 27 and 28:
Hence, the pattern of trade illustr
- Page 29 and 30:
Table 1.4: Changes in farm structur
- Page 31 and 32:
of the pathway to food and nutritio
- Page 33 and 34:
Jayne, T. S., Chamberlin, J., Traub
- Page 35 and 36:
KEY MESSAGES ONE CAADP is an unpara
- Page 37 and 38:
Figure 2.1.Overview of the CAADP Im
- Page 39 and 40:
level. The success of ReSAKSS is be
- Page 41 and 42:
agricultural potential, alternative
- Page 43 and 44:
Table 2.1: Trends in selected CAADP
- Page 45 and 46:
poverty fell faster during this per
- Page 47 and 48:
expenditure (research, extension, i
- Page 49 and 50:
Table 2.4. Average annual change in
- Page 51 and 52:
captures the individual pathways of
- Page 53 and 54:
MA also has to be underpinned by lo
- Page 55 and 56:
References African Union. (2014). M
- Page 57 and 58:
Meenakshi, J.V., Johnson, N.L., Man
- Page 59 and 60:
KEY MESSAGES ONE TWO THREE FOUR Afr
- Page 61 and 62:
GDP declined by 1.4 percent in 2009
- Page 63 and 64:
from political violence, terrorism,
- Page 65 and 66:
interpretation is implied, this obs
- Page 67 and 68:
Differences in the African pattern
- Page 69 and 70:
Table 3.5: Trends in types of emplo
- Page 71 and 72:
that would likely affect the contri
- Page 73 and 74:
c. Concentration of farm structure
- Page 75 and 76:
a. Invest in education to upgrade t
- Page 77 and 78:
These could include policy measures
- Page 79 and 80:
References African Center for Econo
- Page 81 and 82:
Giller, K. E., Rowe, E. C., de Ridd
- Page 83 and 84:
Ndung’u, N. S. (2016). Viewpoint:
- Page 85 and 86:
World Bank. (2015). World developme
- Page 87 and 88:
KEY MESSAGES ONE Although sustainab
- Page 89 and 90:
BOX 4.1: Components of Sustainable
- Page 91 and 92:
of the world. These authors also re
- Page 93 and 94:
Further, Locatelli et al. (2008) ha
- Page 95 and 96:
Climate and Weather Variability The
- Page 97 and 98:
Resilience of livelihoods is determ
- Page 99 and 100:
While acknowledging successes of SI
- Page 101 and 102:
Entry Points For Sustainable Intens
- Page 103 and 104:
BOX 4.4: The CSA Compendium: A scie
- Page 105 and 106:
Successful interventions include fo
- Page 107 and 108:
Open data combined with agricultura
- Page 109 and 110:
According to Tshibaka (2014), evide
- Page 111 and 112:
References Abdulai, A., & Delgado,
- Page 113 and 114:
Enfors, E. (2013). Social-ecologica
- Page 115 and 116:
Lipper, L., Thornton, P., Campbell,
- Page 117 and 118:
Toulmin, C., Leonard, R., Brock, K.
- Page 119 and 120:
KEY MESSAGES ONE In SSA, sustainabl
- Page 121 and 122:
Figure 5.1: Poverty traps framework
- Page 123 and 124:
Cereal Yield/Kilogram Per Hectare F
- Page 125 and 126:
Table 5.2: Correlation between fact
- Page 127 and 128:
Table 5.3: Farmer use of improved i
- Page 129 and 130:
Figure 5.9: Agricultural research s
- Page 131 and 132:
association is found for cereal out
- Page 133 and 134:
AGRA’s Experience The observation
- Page 135 and 136:
Increase access to affordable crop
- Page 137 and 138:
Sheahan, M., & Barrett, C. B. (2014
- Page 139 and 140:
KEY MESSAGES ONE Smallholder farmer
- Page 141 and 142:
transformation in Africa. The achie
- Page 143 and 144:
from agribusiness actors to smallho
- Page 145 and 146:
season, maize prices could be 270 p
- Page 147 and 148:
critical challenges and the solutio
- Page 149 and 150:
Limited access and high cost of acc
- Page 151 and 152:
of onion production in northern Gha
- Page 153 and 154:
Conclusions This chapter presents t
- Page 155 and 156:
Collins, D., Morduch, ,. J., Ruther
- Page 157 and 158:
Minot, N. (2014). Food price volati
- Page 159 and 160:
Weatherspoon, D. D., & Reardon, T.
- Page 161 and 162:
KEY MESSAGES ONE Access to finance
- Page 163 and 164:
esources into agriculture. This in
- Page 165 and 166:
Table 7.1: Indicative investments t
- Page 167 and 168:
technical knowledge about products.
- Page 169 and 170:
continue to experience inadequate a
- Page 171 and 172:
Box 7.1: GAFSP: Country Examples Rw
- Page 173 and 174:
Private Equity Association, total p
- Page 175 and 176:
drawing down assets, and 25 percent
- Page 177 and 178:
equires: recognition of the critica
- Page 179 and 180:
Policy Recommendations This review
- Page 181 and 182:
Meyer, R. L. (2015, March). Financi
- Page 183 and 184:
KEY MESSAGES ONE The African contin
- Page 185 and 186:
Figure 8.1: Mobile phone based serv
- Page 187 and 188:
high input costs, and a disconnecte
- Page 189 and 190:
available through less high-tech de
- Page 191 and 192:
Figure 8.4: Kenya leads the pack fo
- Page 193 and 194:
years and higher quality seeds are
- Page 195 and 196:
CASE STUDY FieldLook South Sudan in
- Page 197 and 198:
Rationale behind rapid adoption •
- Page 199 and 200:
CASE STUDY Eastern Africa Farmer Fe
- Page 201 and 202:
many others have none or have strin
- Page 203 and 204:
the strategic adoption of ICT with
- Page 205 and 206:
To address constraints to improving
- Page 207 and 208:
References Accenture. (2015). Digit
- Page 209 and 210:
Gustafson, S. (27.1.2016). The Digi
- Page 211 and 212:
Wolfenson K. D. (2013). Coping with
- Page 213 and 214:
KEY MESSAGES ONE A guided evolution
- Page 215 and 216:
een registered over the last decade
- Page 217 and 218:
the AIS paradigm at policy and prog
- Page 219 and 220:
Box 9.2: Rwanda - A Phoenix Rising
- Page 221 and 222:
other supportive partners (tertiary
- Page 223 and 224:
Table 9.2: SSA AR4D funding through
- Page 225 and 226:
(e.g., NARIs, universities, NGOs, F
- Page 227 and 228:
Table 9.3: Number of extension agen
- Page 229 and 230: the whole farm whereas the field sc
- Page 231 and 232: approach, organizational or system
- Page 233 and 234: CASE STUDY Regional Universities Fo
- Page 235 and 236: CASE STUDY African Network for Agri
- Page 237 and 238: CASE STUDY FAO—Tropical Agricultu
- Page 239 and 240: Bizimana, C. (2014). Rwanda’s Ach
- Page 241 and 242: Rwanda. Retrieved from http://www.m
- Page 243 and 244: World Bank. (2007). Project Apprais
- Page 245 and 246: KEY MESSAGES ONE The poverty rate a
- Page 247 and 248: Table 10.1: Number of undernourishe
- Page 249 and 250: Figure 10.6: Stunting in children u
- Page 251 and 252: Why single out nutrition matters? A
- Page 253 and 254: BOX 10.1: The 7 Malabo Declaration
- Page 255 and 256: Reducing post-harvest losses FAO es
- Page 257 and 258: BOX 10.4: Growing trend towards a m
- Page 259 and 260: References African Union. (2015). T
- Page 261 and 262: Schmidt, R. H., & Rodrick, G. E. (2
- Page 263 and 264: “Africa is simply tired of being
- Page 265 and 266: 2025, tripling intra-African trade,
- Page 267 and 268: towards agricultural transformation
- Page 269 and 270: While agricultural research generat
- Page 271 and 272: 258 AFRICA AGRICULTURE STATUS REPOR
- Page 273 and 274: Technical Notes The following conve
- Page 275 and 276: Madagascar 72.6 72.3 72.1 71.8 71.2
- Page 277 and 278: Madagascar 2.81 -15.28 6.54 2.19 1.
- Page 279: Madagascar 351.1 337.2 332.9 323.7
- Page 283 and 284: Madagascar 86.0 84.2 87.3 91.8 103.
- Page 285 and 286: Mali .. .. 52.0 15.7 17.5 31.1 22.5
- Page 287 and 288: Madagascar -0.0053 -0.0075 0.0073 -
- Page 289 and 290: Malawi 401.9 405.1 437.2 438.9 511.
- Page 291 and 292: Madagascar 0.2 0.3 0.4 0.5 0.6 0.6
- Page 293 and 294: Madagascar 0.9 1.0 1.6 1.9 2.8 5.6
- Page 295 and 296: Liberia .. .. .. .. .. .. .. .. ..
- Page 297: Liberia 2.0 1.9 1.8 1.7 1.5 1.3 1.5