

AFRICA AGRICULTURE STATUS REPORT 2016
AASR-report_2016-1
AASR-report_2016-1

Create successful ePaper yourself
Turn your PDF publications into a flip-book with our unique Google optimized e-Paper software.
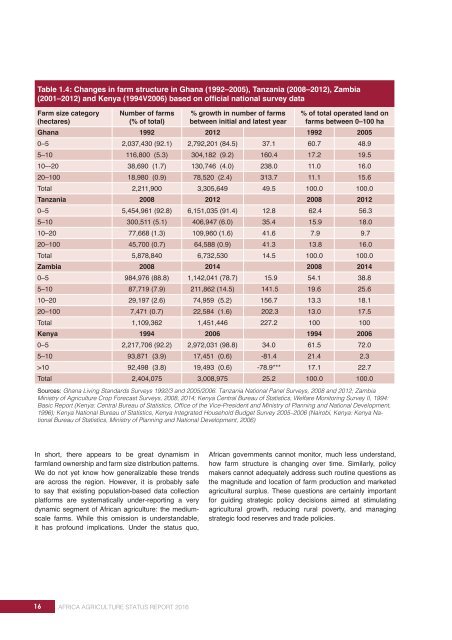
Table 1.4: Changes in farm structure in Ghana (1992–2005), Tanzania (2008–2012), Zambia<br />
(2001–2012) and Kenya (1994V2006) based on official national survey data<br />
Farm size category<br />
(hectares)<br />
Number of farms<br />
(% of total)<br />
% growth in number of farms<br />
between initial and latest year<br />
% of total operated land on<br />
farms between 0–100 ha<br />
Ghana 1992 2012 1992 2005<br />
0–5 2,037,430 (92.1) 2,792,201 (84.5) 37.1 60.7 48.9<br />
5–10 116,800 (5.3) 304,182 (9.2) 160.4 17.2 19.5<br />
10–-20 38,690 (1.7) 130,746 (4.0) 238.0 11.0 16.0<br />
20–100 18,980 (0.9) 78,520 (2.4) 313.7 11.1 15.6<br />
Total 2,211,900 3,305,649 49.5 100.0 100.0<br />
Tanzania 2008 2012 2008 2012<br />
0–5 5,454,961 (92.8) 6,151,035 (91.4) 12.8 62.4 56.3<br />
5–10 300,511 (5.1) 406,947 (6.0) 35.4 15.9 18.0<br />
10–20 77,668 (1.3) 109,960 (1.6) 41.6 7.9 9.7<br />
20–100 45,700 (0.7) 64,588 (0.9) 41.3 13.8 16.0<br />
Total 5,878,840 6,732,530 14.5 100.0 100.0<br />
Zambia 2008 2014 2008 2014<br />
0–5 984,976 (88.8) 1,142,041 (78.7) 15.9 54.1 38.8<br />
5–10 87,719 (7.9) 211,862 (14.5) 141.5 19.6 25.6<br />
10–20 29,197 (2.6) 74,959 (5.2) 156.7 13.3 18.1<br />
20–100 7,471 (0.7) 22,584 (1.6) 202.3 13.0 17.5<br />
Total 1,109,362 1,451,446 227.2 100 100<br />
Kenya 1994 2006 1994 2006<br />
0–5 2,217,706 (92.2) 2,972,031 (98.8) 34.0 61.5 72.0<br />
5–10 93,871 (3.9) 17,451 (0.6) -81.4 21.4 2.3<br />
>10 92,498 (3.8) 19,493 (0.6) -78.9*** 17.1 22.7<br />
Total 2,404,075 3,008,975 25.2 100.0 100.0<br />
Sources: Ghana Living Standards Surveys 1992/3 and 2005/2006. Tanzania National Panel Surveys, 2008 and 2012; Zambia<br />
Ministry of Agriculture Crop Forecast Surveys, 2008, 2014; Kenya Central Bureau of Statistics, Welfare Monitoring Survey II, 1994:<br />
Basic Report (Kenya: Central Bureau of Statistics, Office of the Vice-President and Ministry of Planning and National Development,<br />
1996); Kenya National Bureau of Statistics, Kenya Integrated Household Budget Survey 2005–2006 (Nairobi, Kenya: Kenya National<br />
Bureau of Statistics, Ministry of Planning and National Development, 2006)<br />
In short, there appears to be great dynamism in<br />
farmland ownership and farm size distribution patterns.<br />
We do not yet know how generalizable these trends<br />
are across the region. However, it is probably safe<br />
to say that existing population-based data collection<br />
platforms are systematically under-reporting a very<br />
dynamic segment of African agriculture: the mediumscale<br />
farms. While this omission is understandable,<br />
it has profound implications. Under the status quo,<br />
African governments cannot monitor, much less understand,<br />
how farm structure is changing over time. Similarly, policy<br />
makers cannot adequately address such routine questions as<br />
the magnitude and location of farm production and marketed<br />
agricultural surplus. These questions are certainly important<br />
for guiding strategic policy decisions aimed at stimulating<br />
agricultural growth, reducing rural poverty, and managing<br />
strategic food reserves and trade policies.<br />
16 <strong>AFRICA</strong> <strong>AGRICULTURE</strong> <strong>STATUS</strong> <strong>REPORT</strong> <strong>2016</strong>