

AFRICA AGRICULTURE STATUS REPORT 2016
AASR-report_2016-1
AASR-report_2016-1

Create successful ePaper yourself
Turn your PDF publications into a flip-book with our unique Google optimized e-Paper software.
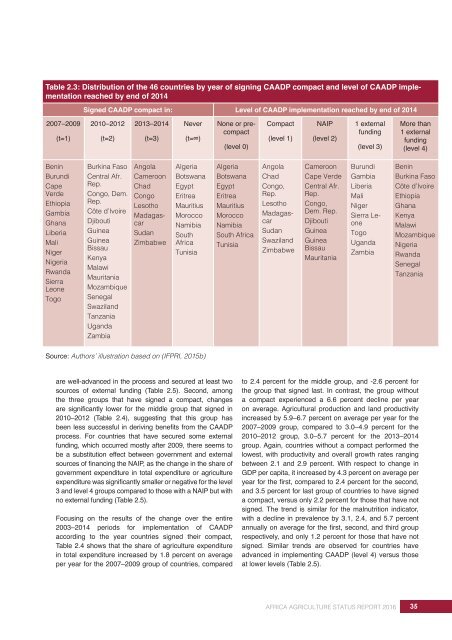
Table 2.3: Distribution of the 46 countries by year of signing CAADP compact and level of CAADP implementation<br />
reached by end of 2014<br />
Signed CAADP compact in: Level of CAADP implementation reached by end of 2014<br />
2007–2009<br />
(t=1)<br />
2010–2012<br />
(t=2)<br />
2013–2014<br />
(t=3)<br />
Never<br />
(t=∞)<br />
None or precompact<br />
(level 0)<br />
Compact<br />
(level 1)<br />
NAIP<br />
(level 2)<br />
1 external<br />
funding<br />
(level 3)<br />
More than<br />
1 external<br />
funding<br />
(level 4)<br />
Benin<br />
Burundi<br />
Cape<br />
Verde<br />
Ethiopia<br />
Gambia<br />
Ghana<br />
Liberia<br />
Mali<br />
Niger<br />
Nigeria<br />
Rwanda<br />
Sierra<br />
Leone<br />
Togo<br />
Burkina Faso<br />
Central Afr.<br />
Rep.<br />
Congo, Dem.<br />
Rep.<br />
Côte d’Ivoire<br />
Djibouti<br />
Guinea<br />
Guinea<br />
Bissau<br />
Kenya<br />
Malawi<br />
Mauritania<br />
Mozambique<br />
Senegal<br />
Swaziland<br />
Tanzania<br />
Uganda<br />
Zambia<br />
Angola<br />
Cameroon<br />
Chad<br />
Congo<br />
Lesotho<br />
Madagascar<br />
Sudan<br />
Zimbabwe<br />
Algeria<br />
Botswana<br />
Egypt<br />
Eritrea<br />
Mauritius<br />
Morocco<br />
Namibia<br />
South<br />
Africa<br />
Tunisia<br />
Algeria<br />
Botswana<br />
Egypt<br />
Eritrea<br />
Mauritius<br />
Morocco<br />
Namibia<br />
South Africa<br />
Tunisia<br />
Angola<br />
Chad<br />
Congo,<br />
Rep.<br />
Lesotho<br />
Madagascar<br />
Sudan<br />
Swaziland<br />
Zimbabwe<br />
Cameroon<br />
Cape Verde<br />
Central Afr.<br />
Rep.<br />
Congo,<br />
Dem. Rep.<br />
Djibouti<br />
Guinea<br />
Guinea<br />
Bissau<br />
Mauritania<br />
Burundi<br />
Gambia<br />
Liberia<br />
Mali<br />
Niger<br />
Sierra Leone<br />
Togo<br />
Uganda<br />
Zambia<br />
Benin<br />
Burkina Faso<br />
Côte d’Ivoire<br />
Ethiopia<br />
Ghana<br />
Kenya<br />
Malawi<br />
Mozambique<br />
Nigeria<br />
Rwanda<br />
Senegal<br />
Tanzania<br />
Source: Authors’ illustration based on (IFPRI, 2015b)<br />
are well-advanced in the process and secured at least two<br />
sources of external funding (Table 2.5). Second, among<br />
the three groups that have signed a compact, changes<br />
are significantly lower for the middle group that signed in<br />
2010–2012 (Table 2.4), suggesting that this group has<br />
been less successful in deriving benefits from the CAADP<br />
process. For countries that have secured some external<br />
funding, which occurred mostly after 2009, there seems to<br />
be a substitution effect between government and external<br />
sources of financing the NAIP, as the change in the share of<br />
government expenditure in total expenditure or agriculture<br />
expenditure was significantly smaller or negative for the level<br />
3 and level 4 groups compared to those with a NAIP but with<br />
no external funding (Table 2.5).<br />
Focusing on the results of the change over the entire<br />
2003–2014 periods for implementation of CAADP<br />
according to the year countries signed their compact,<br />
Table 2.4 shows that the share of agriculture expenditure<br />
in total expenditure increased by 1.8 percent on average<br />
per year for the 2007–2009 group of countries, compared<br />
to 2.4 percent for the middle group, and -2.6 percent for<br />
the group that signed last. In contrast, the group without<br />
a compact experienced a 6.6 percent decline per year<br />
on average. Agricultural production and land productivity<br />
increased by 5.9–6.7 percent on average per year for the<br />
2007–2009 group, compared to 3.0–4.9 percent for the<br />
2010–2012 group, 3.0–5.7 percent for the 2013–2014<br />
group. Again, countries without a compact performed the<br />
lowest, with productivity and overall growth rates ranging<br />
between 2.1 and 2.9 percent. With respect to change in<br />
GDP per capita, it increased by 4.3 percent on average per<br />
year for the first, compared to 2.4 percent for the second,<br />
and 3.5 percent for last group of countries to have signed<br />
a compact, versus only 2.2 percent for those that have not<br />
signed. The trend is similar for the malnutrition indicator,<br />
with a decline in prevalence by 3.1, 2.4, and 5.7 percent<br />
annually on average for the first, second, and third group<br />
respectively, and only 1.2 percent for those that have not<br />
signed. Similar trends are observed for countries have<br />
advanced in implementing CAADP (level 4) versus those<br />
at lower levels (Table 2.5).<br />
<strong>AFRICA</strong> <strong>AGRICULTURE</strong> <strong>STATUS</strong> <strong>REPORT</strong> <strong>2016</strong><br />
35