- Page 1: Malawi Demographic and Health Surve
- Page 4 and 5: The 2015-16 Malawi Demographic and
- Page 6 and 7: 4.3 Age at First Marriage .........
- Page 8 and 9: 13.9.1 Knowledge ..................
- Page 11 and 12: TABLES AND FIGURES 1 INTRODUCTION A
- Page 13 and 14: 6 FERTILITY PREFERENCES ...........
- Page 15 and 16: 11 NUTRITION OF CHILDREN AND WOMEN
- Page 17 and 18: Figure 14.1 HIV prevalence by age .
- Page 19 and 20: Table A-3.8.1 Type of earnings: Wom
- Page 21 and 22: Table A-16.9.1 Women’s participat
- Page 23: FOREWORD T he 2016-16 Malawi Demogr
- Page 26 and 27: LA LAM LLIN LPG MAD MDHS MICS PPHC
- Page 28 and 29: Table 3.4.1 Exposure to mass media:
- Page 30 and 31: Example 2: Prevalence and Treatment
- Page 32 and 33: Example 3: Understanding Sampling W
- Page 34 and 35: xxxii • Map of Malawi
- Page 36 and 37: The information collected in the 20
- Page 38 and 39: ecorded on the Biomarker Questionna
- Page 40 and 41: 1.5 PRETEST The pretest for the 201
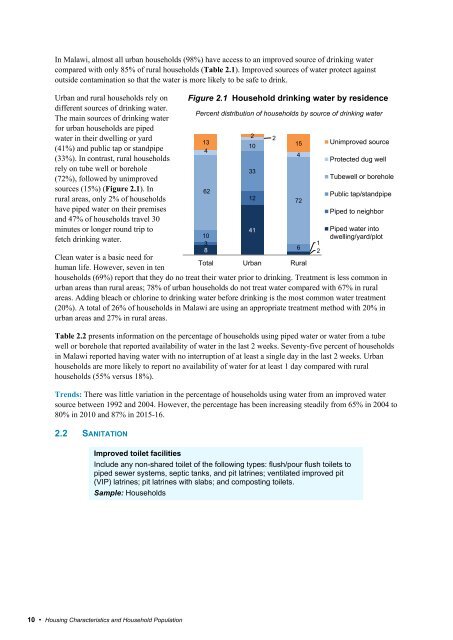
- Page 43: HOUSING CHARACTERISTICS AND 2 HOUSE
- Page 47 and 48: A total of 117,177 individuals stay
- Page 49 and 50: Patterns by background characterist
- Page 51 and 52: school. The attendance rate decline
- Page 53 and 54: Table 2.3 Household sanitation faci
- Page 55 and 56: Table 2.5 Wealth quintiles Percent
- Page 57 and 58: Table 2.9 Household composition Per
- Page 59 and 60: Table 2.11 Children’s living arra
- Page 61 and 62: Table 2.12.2 Educational attainment
- Page 63 and 64: Table 2.14.1 Child functioning and
- Page 65 and 66: CHARACTERISTICS OF RESPONDENTS 3 Ke
- Page 67 and 68: • Women and men living in urban a
- Page 69 and 70: Women and men are most commonly emp
- Page 71 and 72: Table 3.1 Background characteristic
- Page 73 and 74: Table 3.3.1 Literacy: Women Percent
- Page 75 and 76: Table 3.5.1 Internet usage: Women P
- Page 77 and 78: Table 3.6.1 Employment status: Wome
- Page 79 and 80: Table 3.7.1 Occupation: Women Perce
- Page 81 and 82: Table 3.8 Type of employment: Women
- Page 83 and 84: Table 3.10.1 Tobacco smoking: Women
- Page 85 and 86: Table 3.11 Average number of cigare
- Page 87: Table 3.13.2 Knowledge and attitude
- Page 90 and 91: Figure 4.1 Marital status Percent d
- Page 92 and 93: marriage. The median age at first i
- Page 94 and 95:
Table 4.1 Current marital status Pe
- Page 96 and 97:
Table 4.3 Age at first marriage Per
- Page 98 and 99:
Table 4.5 Age at first sexual inter
- Page 100 and 101:
Table 4.7.1 Recent sexual activity:
- Page 103 and 104:
FERTILITY 5 Key Findings Total
- Page 105 and 106:
5.3 BIRTH INTERVALS Median birth in
- Page 107 and 108:
5.5 AGE AT FIRST BIRTH Median age a
- Page 109 and 110:
LIST OF TABLES For more information
- Page 111 and 112:
Table 5.3.1 Trends in age-specific
- Page 113 and 114:
Table 5.6 Postpartum amenorrhea, ab
- Page 115:
Table 5.10 Median age at first birt
- Page 118 and 119:
Trends: The percentage of currently
- Page 120 and 121:
Trends: Since 1992, the proportion
- Page 122 and 123:
Table 6.1 Fertility preferences by
- Page 124 and 125:
Table 6.3 Ideal number of children
- Page 126 and 127:
Table 6.5 Fertility planning status
- Page 128 and 129:
Overall, the contraceptive prevalen
- Page 130 and 131:
Nearly 8 in 10 (79%) of all modern
- Page 132 and 133:
Seventy-eight percent of currently
- Page 134 and 135:
the survey (Table 7.16). Ten percen
- Page 136 and 137:
Table 7.3 Current use of contracept
- Page 138 and 139:
Table 7.7 Informed choice Among cur
- Page 140 and 141:
Table 7.12.1 Need and demand for fa
- Page 142 and 143:
Table 7.13 Decision-making about fa
- Page 144 and 145:
Table 7.16 Contact of nonusers with
- Page 146 and 147:
• Any method of measuring childho
- Page 148 and 149:
Patterns by background characterist
- Page 150 and 151:
Table 8.3 Early childhood mortality
- Page 152 and 153:
Table 8.5 High-risk fertility behav
- Page 154 and 155:
9.1 ANTENATAL CARE COVERAGE AND CON
- Page 156 and 157:
Patterns by background characterist
- Page 158 and 159:
Trends: Since 1992, the rates of C-
- Page 160 and 161:
9.7 PROBLEMS IN ACCESSING HEALTH CA
- Page 162 and 163:
Table 9.3 Components of antenatal c
- Page 164 and 165:
Table 9.5 Place of delivery Percent
- Page 166 and 167:
Table 9.7 Caesarean section Percent
- Page 168 and 169:
Table 9.10 Type of provider of firs
- Page 170 and 171:
Table 9.12 Type of provider of firs
- Page 172 and 173:
Table 9.14 Pregnancy outcomes Perce
- Page 174 and 175:
Table 9.16 Problems in accessing he
- Page 176 and 177:
childhood death. In the 2015-16 MDH
- Page 178 and 179:
• Vaccination coverage generally
- Page 180 and 181:
of giving the same or more food to
- Page 182 and 183:
Table 10.1 Child’s size and weigh
- Page 184 and 185:
Table 10.3 Vaccinations by backgrou
- Page 186 and 187:
Table 10.5 Prevalence and treatment
- Page 188 and 189:
Table 10.7 Prevalence and treatment
- Page 190 and 191:
Table 10.9 Oral rehydration therapy
- Page 192 and 193:
Table 10.11 Disposal of children’
- Page 194 and 195:
which the baby’s weight to be dis
- Page 196 and 197:
11.2 INFANT AND YOUNG CHILD FEEDING
- Page 198 and 199:
have shown that plant-based complem
- Page 200 and 201:
11.3 ANAEMIA PREVALENCE IN CHILDREN
- Page 202 and 203:
Information on BMI is presented in
- Page 204 and 205:
Table 11.1 Nutritional status of ch
- Page 206 and 207:
Table 11.3 Breastfeeding status acc
- Page 208 and 209:
Table 11.5 Foods and liquids consum
- Page 210 and 211:
Table 11.7 Prevalence of anaemia in
- Page 212 and 213:
Table 11.9 Micronutrient intake amo
- Page 214 and 215:
Table 11.11 Nutritional status of w
- Page 216 and 217:
Table 11.13 Micronutrient intake am
- Page 218 and 219:
The ownership and use of both treat
- Page 220 and 221:
12.3 HOUSEHOLD ACCESS AND USE OF IT
- Page 222 and 223:
SP during routine ANC visits. Follo
- Page 224 and 225:
Trends: The percentage of children
- Page 226 and 227:
Table 12.3 Indoor residual spraying
- Page 228 and 229:
Table 12.7 Use of existing ITNs Per
- Page 230 and 231:
Table 12.11 Prevalence, diagnosis,
- Page 232 and 233:
Table 12.13 Type of antimalarial dr
- Page 235 and 236:
HIV/AIDS-RELATED KNOWLEDGE, 13 ATTI
- Page 237 and 238:
avoid getting HIV; 64% of women and
- Page 239 and 240:
Only 1% of all women reported havin
- Page 241 and 242:
Patterns by background characterist
- Page 243 and 244:
Forty-two percent of women and 41%
- Page 245 and 246:
13.9.3 Premarital Sex The 2015-16 M
- Page 247 and 248:
Table 13.1 Knowledge of HIV prevent
- Page 249 and 250:
Table 13.4 Discriminatory attitudes
- Page 251 and 252:
Table 13.5.2 Multiple sexual partne
- Page 253 and 254:
Table 13.7.1 Coverage of prior HIV
- Page 255 and 256:
Table 13.8 Pregnant women counselle
- Page 257 and 258:
Table 13.10 Self-reported prevalenc
- Page 259 and 260:
Table 13.13 Premarital sexual inter
- Page 261 and 262:
Table 13.14.2 Multiple sexual partn
- Page 263 and 264:
HIV PREVALENCE 14 Key Findings HIV
- Page 265 and 266:
The HIV prevalence among women and
- Page 267 and 268:
Patterns by background characterist
- Page 269 and 270:
Table 14.1 Coverage of HIV testing
- Page 271 and 272:
Table 14.3 HIV prevalence according
- Page 273 and 274:
Table 14.5 HIV prevalence according
- Page 275 and 276:
Table 14.7 HIV prevalence among you
- Page 277 and 278:
Table 14.11 HIV prevalence by male
- Page 279 and 280:
ADULT AND MATERNAL MORTALITY 15 Key
- Page 281 and 282:
Trends: Table 15.3 shows the probab
- Page 283 and 284:
Table 15.1 Completeness of informat
- Page 285 and 286:
WOMEN’S EMPOWERMENT 16 Key Findin
- Page 287 and 288:
husbands while smaller proportions
- Page 289 and 290:
Patterns by background characterist
- Page 291 and 292:
5% participate in neither decisions
- Page 293 and 294:
from 78% to 74%. The percentage of
- Page 295 and 296:
16.16 REPRODUCTIVE HEALTH CARE BY W
- Page 297 and 298:
Table 16.2.1 Control over women’s
- Page 299 and 300:
Table 16.4.1 Ownership of assets: W
- Page 301 and 302:
Table 16.5.2 Ownership of title or
- Page 303 and 304:
Table 16.7.1 Ownership and use of b
- Page 305 and 306:
Table 16.9.2 Men’s participation
- Page 307 and 308:
Table 16.10.2 Attitude toward wife
- Page 309 and 310:
Table 16.12 Ability to negotiate se
- Page 311:
Table 16.16 Reproductive health car
- Page 314 and 315:
harassment.” Most recently, the M
- Page 316 and 317:
• The experience of physical viol
- Page 318 and 319:
• Women’s experience of at leas
- Page 320 and 321:
women to have ever experienced spou
- Page 322 and 323:
• Women in urban areas are about
- Page 324 and 325:
Table 17.1 Experience of physical v
- Page 326 and 327:
Table 17.3 Persons committing physi
- Page 328 and 329:
Table 17.5 Age at first experience
- Page 330 and 331:
Table 17.9 Forms of spousal violenc
- Page 332 and 333:
Table 17.11 Spousal violence accord
- Page 334 and 335:
Table 17.13 Experience of spousal v
- Page 336 and 337:
Table 17.16 Violence by women again
- Page 338 and 339:
Table 17.18 Sources for help to sto
- Page 340 and 341:
World Health Organization (WHO) and
- Page 342 and 343:
Table A-2.3 Household sanitation fa
- Page 344 and 345:
Table A-2.7 Hand washing: Districts
- Page 346 and 347:
Table A-2.11 Children’s living ar
- Page 348 and 349:
Table A-2.12.2 Educational attainme
- Page 350 and 351:
Table A-3.2.1 Educational attainmen
- Page 352 and 353:
Table A-3.3.1 Literacy: Women by di
- Page 354 and 355:
Table A-3.4.1 Exposure to mass medi
- Page 356 and 357:
Table A-3.5.1 Internet usage: Women
- Page 358 and 359:
Table A-3.6.1 Employment status: Wo
- Page 360 and 361:
Table A-3.7.1 Occupation: Women by
- Page 362 and 363:
Table A-3.8.1 Type of earnings: Wom
- Page 364 and 365:
Table A-3.8.3 Continuity of employm
- Page 366 and 367:
Table A-3.13.1 Knowledge and attitu
- Page 368 and 369:
CHAPTER 4 MARRIAGE AND SEXUAL ACTIV
- Page 370 and 371:
Table A-4.4 Median age at first mar
- Page 372 and 373:
Table A-4.7.1 Recent sexual activit
- Page 374 and 375:
CHAPTER 5 FERTILITY Table A-5.2 Fer
- Page 376 and 377:
Table A-5.10 Median age at first bi
- Page 378 and 379:
CHAPTER 6 FERTILITY PREFERENCES Tab
- Page 380 and 381:
CHAPTER 7 FAMILY PLANNING Table A-7
- Page 382 and 383:
Table A-7.13 Decision-making about
- Page 384 and 385:
Table A-7.16 Contact of nonusers wi
- Page 386 and 387:
CHAPTER 9 MATERNAL HEALTH CARE Tabl
- Page 388 and 389:
Table A-9.4 Tetanus toxoid injectio
- Page 390 and 391:
Table A-9.6 Assistance during deliv
- Page 392 and 393:
Table A-9.9 Timing of first postnat
- Page 394 and 395:
Table A-9.11 Timing of first postna
- Page 396 and 397:
Table A-9.13 Content of postnatal c
- Page 398 and 399:
Table A-9.15 Prevalence of obstetri
- Page 400 and 401:
CHAPTER 10 CHILD HEALTH Table A-10.
- Page 402 and 403:
Table A-10.4 Possession and observa
- Page 404 and 405:
Table A-10.6 Prevalence and treatme
- Page 406 and 407:
Table A-10.8 Feeding practices duri
- Page 408 and 409:
Table A-10.10 Knowledge of ORS pack
- Page 410 and 411:
CHAPTER 11 NUTRITION OF CHILDREN AN
- Page 412 and 413:
Table A-11.2 Initial breastfeeding:
- Page 414 and 415:
Table A-11.7 Prevalence of anaemia
- Page 416 and 417:
Table A-11.9 Micronutrient intake a
- Page 418 and 419:
Table A-11.11 Nutritional status of
- Page 420 and 421:
Table A-11.13 Micronutrient intake
- Page 422 and 423:
Table A-12.2 Source of mosquito net
- Page 424 and 425:
Table A-12.6 Use of mosquito nets b
- Page 426 and 427:
Table A-12.8 Use of mosquito nets b
- Page 428 and 429:
Table A-12.10 Use of Intermittent P
- Page 430 and 431:
Table A-12.14 Haemoglobin
- Page 432 and 433:
Table A-13.4 Discriminatory attitud
- Page 434 and 435:
Table A-13.5.2 Multiple sexual part
- Page 436 and 437:
Table A-13.7.1 Coverage of prior HI
- Page 438 and 439:
Table A-13.8 Pregnant women counsel
- Page 440 and 441:
Table A-13.10 Self-reported prevale
- Page 442 and 443:
Table A-13.12 Age at first sexual i
- Page 444 and 445:
Table A-13.14.1 Multiple sexual par
- Page 446 and 447:
CHAPTER 14 HIV PREVALENCE Table A-1
- Page 448 and 449:
Table A-14.3 HIV prevalence: Distri
- Page 450 and 451:
CHAPTER 16 WOMEN’S EMPOWERMENT Ta
- Page 452 and 453:
Table A-16.4.1 Ownership of assets:
- Page 454 and 455:
Table A-16.5.1 Ownership of title o
- Page 456 and 457:
Table A-16.6.1 Ownership of title o
- Page 458 and 459:
Table A-16.7.1 Ownership and use of
- Page 460 and 461:
Table A-16.9.1 Women’s participat
- Page 462 and 463:
Table A-16.10.1 Attitude toward wif
- Page 464 and 465:
Table A-16.11 Attitudes toward nego
- Page 466 and 467:
CHAPTER 17 DOMESTIC VIOLENCE Table
- Page 468 and 469:
Table A-17.4 Experience of sexual v
- Page 470 and 471:
Table A-17.10 Spousal violence: Dis
- Page 472 and 473:
Table A-17.15 Violence by women aga
- Page 475 and 476:
SAMPLE DESIGN Appendix B B.1 INTROD
- Page 477 and 478:
two-stage stratified cluster sample
- Page 479 and 480:
Table B.1 Distribution of residenti
- Page 481 and 482:
Table B.4 Sample allocation of comp
- Page 483 and 484:
Table B.6 Sample implementation: Me
- Page 485 and 486:
Table B.8 Coverage of HIV testing b
- Page 487:
Table B.10 Coverage of HIV testing
- Page 490 and 491:
where h represents the stratum whic
- Page 492 and 493:
Table C.2 Sampling errors: Total sa
- Page 494 and 495:
Table C.4 Sampling errors: Rural sa
- Page 496 and 497:
Table C.6 Sampling errors: Central
- Page 498 and 499:
Table C.8 Sampling errors: Chitipa
- Page 500 and 501:
Table C.10 Sampling errors: Nkhatab
- Page 502 and 503:
Table C.12 Sampling errors: Mzimba
- Page 504 and 505:
Table C.14 Sampling errors: Kasungu
- Page 506 and 507:
Table C.16 Sampling errors: Ntchisi
- Page 508 and 509:
Table C.18 Sampling errors: Salima
- Page 510 and 511:
Table C.20 Sampling errors: Mchinji
- Page 512 and 513:
Table C.22 Sampling errors: Ntcheu
- Page 514 and 515:
Table C.24 Sampling errors: Maching
- Page 516 and 517:
Table C.26 Sampling errors: Chiradz
- Page 518 and 519:
Table C.28 Sampling errors: Mwanza
- Page 520 and 521:
Table C.30 Sampling errors: Mulanje
- Page 522 and 523:
Table C.32 Sampling errors: Chikwaw
- Page 524 and 525:
Table C.34 Sampling errors: Balaka
- Page 526 and 527:
Table C.36 Sampling errors for adul
- Page 528 and 529:
Table D.2.1 Age distribution of eli
- Page 530 and 531:
Table D.5 Reporting of age at death
- Page 532 and 533:
Table D.7 Nutritional status of chi
- Page 535 and 536:
SURVEY PERSONNEL Appendix E 2015-16
- Page 537 and 538:
Team Leaders Benson Mvula Grossveno
- Page 539:
Ireen Yohane Chisomo Mkwapatira Des
- Page 543 and 544:
2015-2016 MALAWI DEMOGRAPHIC AND HE
- Page 545 and 546:
INTRODUCTION AND CONSENT Hello. My
- Page 547 and 548:
HOUSEHOLD SCHEDULE IF AGE 0-17 YEAR
- Page 549 and 550:
HOUSEHOLD SCHEDULE IF AGE 0-17 YEAR
- Page 551 and 552:
HOUSEHOLD CHARACTERISTICS NO. QUEST
- Page 553 and 554:
HOUSEHOLD CHARACTERISTICS NO. QUEST
- Page 555 and 556:
MOSQUITO NETS NET #1 NET #2 NET #3
- Page 557 and 558:
ADDITIONAL HOUSEHOLD CHARACTERISTIC
- Page 559 and 560:
200 CHILD FUNCTIONING AND DISABILIT
- Page 561 and 562:
300 CHILD FUNCTIONING AND DISABILIT
- Page 563 and 564:
CHILD FUNCTIONING AND DISABILITY (A
- Page 565 and 566:
ELIGIBILITY AND CONSENT FOR THE MIC
- Page 567 and 568:
INTERVIEWER'S OBSERVATIONS TO BE FI
- Page 569 and 570:
2015-2016 MALAWI DEMOGRAPHIC AND HE
- Page 571 and 572:
WEIGHT, HEIGHT AND HEMOGLOBIN MEASU
- Page 573 and 574:
WEIGHT, HEIGHT AND HEMOGLOBIN MEASU
- Page 575 and 576:
WEIGHT, HEIGHT, HEMOGLOBIN MEASUREM
- Page 577 and 578:
WEIGHT, HEIGHT, HEMOGLOBIN MEASUREM
- Page 579 and 580:
WEIGHT, HEIGHT, HEMOGLOBIN MEASUREM
- Page 581 and 582:
HIV TESTING FOR MEN AGE 15-54 301 C
- Page 583 and 584:
WEIGHT, HEIGHT, HEMOGLOBIN MEASUREM
- Page 585 and 586:
WEIGHT, HEIGHT, HEMOGLOBIN MEASUREM
- Page 587 and 588:
2015-2016 MALAWI DEMOGRAPHIC AND HE
- Page 589 and 590:
SECTION 1. RESPONDENT'S BACKGROUND
- Page 591 and 592:
SECTION 2. REPRODUCTION NO. QUESTIO
- Page 593 and 594:
212 213 214 215 216 217 218 219 220
- Page 595 and 596:
SECTION 2. REPRODUCTION NO. QUESTIO
- Page 597 and 598:
SECTION 3. CONTRACEPTION 301 Now I
- Page 599 and 600:
SECTION 3. CONTRACEPTION NO. QUESTI
- Page 601 and 602:
SECTION 3. CONTRACEPTION NO. QUESTI
- Page 603 and 604:
SECTION 3. CONTRACEPTION NO. QUESTI
- Page 605 and 606:
SECTION 4. PREGNANCY AND POSTNATAL
- Page 607 and 608:
SECTION 4. PREGNANCY AND POSTNATAL
- Page 609 and 610:
SECTION 4. PREGNANCY AND POSTNATAL
- Page 611 and 612:
SECTION 4. PREGNANCY AND POSTNATAL
- Page 613 and 614:
SECTION 4. PREGNANCY AND POSTNATAL
- Page 615 and 616:
SECTION 5A. CHILD IMMUNIZATION (LAS
- Page 617 and 618:
SECTION 5A. CHILD IMMUNIZATION (LAS
- Page 619 and 620:
SECTION 5B. CHILD IMMUNIZATION (NEX
- Page 621 and 622:
SECTION 5B. CHILD IMMUNIZATION (NEX
- Page 623 and 624:
SECTION 6. CHILD HEALTH AND NUTRITI
- Page 625 and 626:
SECTION 6. CHILD HEALTH AND NUTRITI
- Page 627 and 628:
SECTION 6. CHILD HEALTH AND NUTRITI
- Page 629 and 630:
SECTION 6. CHILD HEALTH AND NUTRITI
- Page 631 and 632:
SECTION 6. CHILD HEALTH AND NUTRITI
- Page 633 and 634:
SECTION 6. CHILD HEALTH AND NUTRITI
- Page 635 and 636:
SECTION 7. MARRIAGE AND SEXUAL ACTI
- Page 637 and 638:
SECTION 7. MARRIAGE AND SEXUAL ACTI
- Page 639 and 640:
SECTION 8. FERTILITY PREFERENCES NO
- Page 641 and 642:
SECTION 8. FERTILITY PREFERENCES NO
- Page 643 and 644:
SECTION 9. HUSBAND'S BACKGROUND AND
- Page 645 and 646:
NO. QUESTIONS AND FILTERS SECTION 1
- Page 647 and 648:
SECTION 10. HIV/AIDS NO. QUESTIONS
- Page 649 and 650:
SECTION 10. HIV/AIDS NO. QUESTIONS
- Page 651 and 652:
SECTION 11. OTHER HEALTH ISSUES NO.
- Page 653 and 654:
SECTION 11. OTHER HEALTH ISSUES NO.
- Page 655 and 656:
SECTION MM. MATERNAL MORTALITY MODU
- Page 657 and 658:
SECTION 13. DOMESTIC VIOLENCE MODUL
- Page 659 and 660:
SECTION 13. DOMESTIC VIOLENCE MODUL
- Page 661 and 662:
SECTION 13. DOMESTIC VIOLENCE MODUL
- Page 663 and 664:
INSTRUCTIONS: COL. 1 COL. 2 ONLY ON
- Page 665 and 666:
2015-2016 MALAWI DEMOGRAPHIC AND HE
- Page 667 and 668:
SECTION 1. RESPONDENT'S BACKGROUND
- Page 669 and 670:
SECTION 2. REPRODUCTION NO. QUESTIO
- Page 671 and 672:
SECTION 3. CONTRACEPTION 301 Now I
- Page 673 and 674:
SECTION 4. MARRIAGE AND SEXUAL ACTI
- Page 675 and 676:
SECTION 4. MARRIAGE AND SEXUAL ACTI
- Page 677 and 678:
SECTION 4. MARRIAGE AND SEXUAL ACTI
- Page 679 and 680:
SECTION 5. FERTILITY PREFERENCES NO
- Page 681 and 682:
SECTION 6. EMPLOYMENT AND GENDER RO
- Page 683 and 684:
SECTION 7. HIV/AIDS NO. QUESTIONS A
- Page 685 and 686:
SECTION 7. HIV/AIDS NO. QUESTIONS A
- Page 687 and 688:
SECTION 8. OTHER HEALTH ISSUES NO.
- Page 689 and 690:
INTERVIEWER'S OBSERVATIONS TO BE FI
- Page 691 and 692:
MALAWI GOVERNEMNT NATIONAL STATISTI