Xcell Journal: The authoritative journal for programmable ... - Xilinx
Xcell Journal: The authoritative journal for programmable ... - Xilinx
Xcell Journal: The authoritative journal for programmable ... - Xilinx

You also want an ePaper? Increase the reach of your titles
YUMPU automatically turns print PDFs into web optimized ePapers that Google loves.
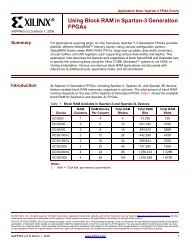
You can look back in time from<br />
any execution to follow the path<br />
backward, or you can use the Seehau<br />
event configuration system to specify<br />
pre- and post-triggering, complex<br />
breakpoints, triggers on register reads<br />
and writes, and triggers on data from<br />
the fabric. Figure 4 shows a typical<br />
source-level debug display with<br />
processor registers, memory data,<br />
program data in source <strong>for</strong>m, and<br />
trace and breakpoint status.<br />
Nohau tools are sold as a system,<br />
which includes the Seehau debugger, an<br />
interface pod to the appropriate JTAG<br />
connector, and the IP DebugTraceBlaze<br />
configured with trace memory. As a system,<br />
it may be ordered as EMUL-<br />
MICROBLAZE-PC.<br />
<strong>The</strong> Nohau EMUL-MICROB-<br />
LAZE-PC provides a 512-frame or<br />
2K-frame deep trace with a trigger,<br />
post-trigger count, and break control.<br />
Probe pins may be either 8 or 40 bits<br />
wide. It will display data connected to<br />
it as specified in the XPS .MHS file.<br />
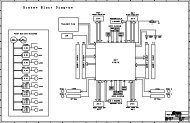
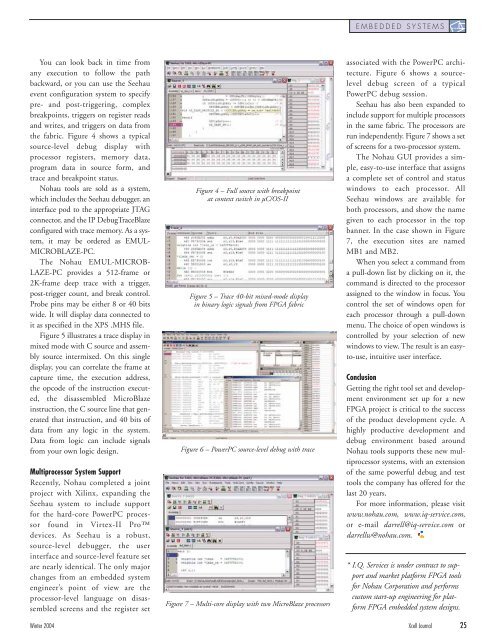
Figure 5 illustrates a trace display in<br />
mixed mode with C source and assembly<br />
source intermixed. On this single<br />
display, you can correlate the frame at<br />
capture time, the execution address,<br />
the opcode of the instruction executed,<br />
the disassembled MicroBlaze<br />
instruction, the C source line that generated<br />
that instruction, and 40 bits of<br />
data from any logic in the system.<br />
Data from logic can include signals<br />
from your own logic design.<br />
Multiprocessor System Support<br />
Recently, Nohau completed a joint<br />
project with <strong>Xilinx</strong>, expanding the<br />
Seehau system to include support<br />
<strong>for</strong> the hard-core PowerPC processor<br />
found in Virtex-II Pro<br />
devices. As Seehau is a robust,<br />
source-level debugger, the user<br />
interface and source-level feature set<br />
are nearly identical. <strong>The</strong> only major<br />
changes from an embedded system<br />
engineer’s point of view are the<br />
processor-level language on disassembled<br />
screens and the register set<br />
Figure 4 – Full source with breakpoint<br />
at context switch in µC/OS-II<br />
Figure 5 – Trace 40-bit mixed-mode display<br />
in binary logic signals from FPGA fabric<br />
Figure 6 – PowerPC source-level debug with trace<br />
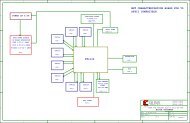
Figure 7 – Multi-core display with two MicroBlaze processors<br />
EMBEDDED SYSTEMS<br />
associated with the PowerPC architecture.<br />
Figure 6 shows a sourcelevel<br />
debug screen of a typical<br />
PowerPC debug session.<br />
Seehau has also been expanded to<br />
include support <strong>for</strong> multiple processors<br />
in the same fabric. <strong>The</strong> processors are<br />
run independently. Figure 7 shows a set<br />
of screens <strong>for</strong> a two-processor system.<br />
<strong>The</strong> Nohau GUI provides a simple,<br />
easy-to-use interface that assigns<br />
a complete set of control and status<br />
windows to each processor. All<br />
Seehau windows are available <strong>for</strong><br />
both processors, and show the name<br />
given to each processor in the top<br />
banner. In the case shown in Figure<br />
7, the execution sites are named<br />
MB1 and MB2.<br />
When you select a command from<br />
a pull-down list by clicking on it, the<br />
command is directed to the processor<br />
assigned to the window in focus. You<br />
control the set of windows open <strong>for</strong><br />
each processor through a pull-down<br />
menu. <strong>The</strong> choice of open windows is<br />
controlled by your selection of new<br />
windows to view. <strong>The</strong> result is an easyto-use,<br />
intuitive user interface.<br />
Conclusion<br />
Getting the right tool set and development<br />
environment set up <strong>for</strong> a new<br />
FPGA project is critical to the success<br />
of the product development cycle. A<br />
highly productive development and<br />
debug environment based around<br />
Nohau tools supports these new multiprocessor<br />
systems, with an extension<br />
of the same powerful debug and test<br />
tools the company has offered <strong>for</strong> the<br />
last 20 years.<br />
For more in<strong>for</strong>mation, please visit<br />
www.nohau.com, www.iq-service.com,<br />
or e-mail darrell@iq-service.com or<br />
darrellw@nohau.com.<br />
* I.Q. Services is under contract to support<br />
and market plat<strong>for</strong>m FPGA tools<br />
<strong>for</strong> Nohau Corporation and per<strong>for</strong>ms<br />
custom start-up engineering <strong>for</strong> plat<strong>for</strong>m<br />
FPGA embedded system designs.<br />
Winter 2004 <strong>Xcell</strong> <strong>Journal</strong> 25