Acute Leukemias - Republican Scientific Medical Library
Acute Leukemias - Republican Scientific Medical Library
Acute Leukemias - Republican Scientific Medical Library
You also want an ePaper? Increase the reach of your titles
YUMPU automatically turns print PDFs into web optimized ePapers that Google loves.
78 Chapter 5 · <strong>Acute</strong> Lymphoblastic Leukemia: Epidemiology and Etiology<br />
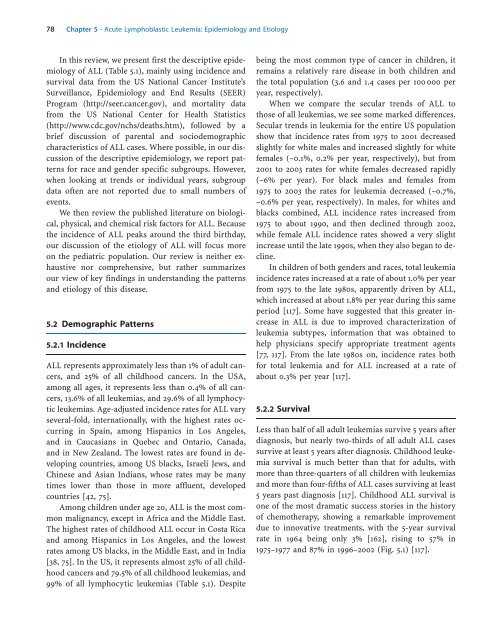
In this review, we present first the descriptive epidemiology<br />
of ALL (Table 5.1), mainly using incidence and<br />
survival data from the US National Cancer Institute’s<br />
Surveillance, Epidemiology and End Results (SEER)<br />
Program (http://seer.cancer.gov), and mortality data<br />
from the US National Center for Health Statistics<br />
(http://www.cdc.gov/nchs/deaths.htm), followed by a<br />
brief discussion of parental and sociodemographic<br />
characteristics of ALL cases. Where possible, in our discussion<br />
of the descriptive epidemiology, we report patterns<br />
for race and gender specific subgroups. However,<br />
when looking at trends or individual years, subgroup<br />
data often are not reported due to small numbers of<br />
events.<br />
We then review the published literature on biological,<br />
physical, and chemical risk factors for ALL. Because<br />
the incidence of ALL peaks around the third birthday,<br />
our discussion of the etiology of ALL will focus more<br />
on the pediatric population. Our review is neither exhaustive<br />
nor comprehensive, but rather summarizes<br />
our view of key findings in understanding the patterns<br />
and etiology of this disease.<br />
5.2 Demographic Patterns<br />
5.2.1 Incidence<br />
ALL represents approximately less than 1% of adult cancers,<br />
and 25% of all childhood cancers. In the USA,<br />
among all ages, it represents less than 0.4% of all cancers,<br />
13.6% of all leukemias, and 29.6% of all lymphocytic<br />
leukemias. Age-adjusted incidence rates for ALL vary<br />
several-fold, internationally, with the highest rates occurring<br />
in Spain, among Hispanics in Los Angeles,<br />
and in Caucasians in Quebec and Ontario, Canada,<br />
and in New Zealand. The lowest rates are found in developing<br />
countries, among US blacks, Israeli Jews, and<br />
Chinese and Asian Indians, whose rates may be many<br />
times lower than those in more affluent, developed<br />
countries [42, 75].<br />
Among children under age 20, ALL is the most common<br />
malignancy, except in Africa and the Middle East.<br />
The highest rates of childhood ALL occur in Costa Rica<br />
and among Hispanics in Los Angeles, and the lowest<br />
rates among US blacks, in the Middle East, and in India<br />
[38, 75]. In the US, it represents almost 25% of all childhood<br />
cancers and 79.5% of all childhood leukemias, and<br />
99% of all lymphocytic leukemias (Table 5.1). Despite<br />
being the most common type of cancer in children, it<br />
remains a relatively rare disease in both children and<br />
the total population (3.6 and 1.4 cases per 100 000 per<br />
year, respectively).<br />
When we compare the secular trends of ALL to<br />
those of all leukemias, we see some marked differences.<br />
Secular trends in leukemia for the entire US population<br />
show that incidence rates from 1975 to 2001 decreased<br />
slightly for white males and increased slightly for white<br />
females (–0.1%, 0.2% per year, respectively), but from<br />
2001 to 2003 rates for white females decreased rapidly<br />
(–6% per year). For black males and females from<br />
1975 to 2003 the rates for leukemia decreased (–0.7%,<br />
–0.6% per year, respectively). In males, for whites and<br />
blacks combined, ALL incidence rates increased from<br />
1975 to about 1990, and then declined through 2002,<br />
while female ALL incidence rates showed a very slight<br />
increase until the late 1990s, when they also began to decline.<br />
In children of both genders and races, total leukemia<br />
incidence rates increased at a rate of about 1.0% per year<br />
from 1975 to the late 1980s, apparently driven by ALL,<br />
which increased at about 1.8% per year during this same<br />
period [117]. Some have suggested that this greater increase<br />
in ALL is due to improved characterization of<br />
leukemia subtypes, information that was obtained to<br />
help physicians specify appropriate treatment agents<br />
[77, 117]. From the late 1980s on, incidence rates both<br />
for total leukemia and for ALL increased at a rate of<br />
about 0.3% per year [117].<br />
5.2.2 Survival<br />
Less than half of all adult leukemias survive 5 years after<br />
diagnosis, but nearly two-thirds of all adult ALL cases<br />
survive at least 5 years after diagnosis. Childhood leukemia<br />
survival is much better than that for adults, with<br />
more than three-quarters of all children with leukemias<br />
and more than four-fifths of ALL cases surviving at least<br />
5 years past diagnosis [117]. Childhood ALL survival is<br />
one of the most dramatic success stories in the history<br />
of chemotherapy, showing a remarkable improvement<br />
due to innovative treatments, with the 5-year survival<br />
rate in 1964 being only 3% [162], rising to 57% in<br />
1975–1977 and 87% in 1996–2002 (Fig. 5.1) [117].


