


Create successful ePaper yourself
Turn your PDF publications into a flip-book with our unique Google optimized e-Paper software.
6<br />
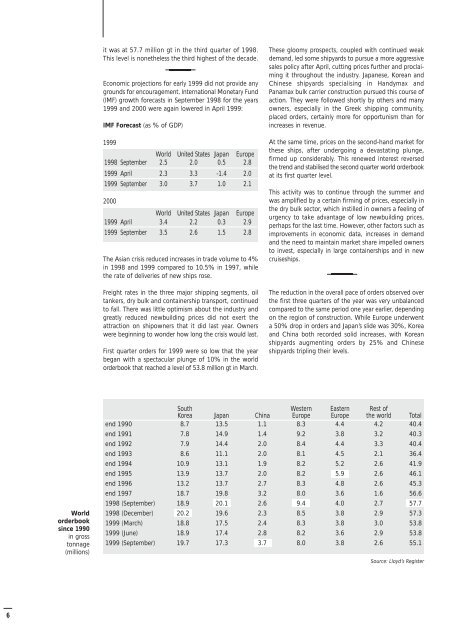
World<br />
orderbook<br />
since 1990<br />
in gross<br />
<strong>to</strong>nnage<br />
(millions)<br />
it was at 57.7 million gt in the third quarter of 1998.<br />
This level is nonetheless the third highest of the decade.<br />
Economic projections for early 1999 did not provide any<br />
grounds for encouragement. International Monetary Fund<br />
(IMF) growth forecasts in September 1998 for the years<br />
1999 and 2000 were again lowered in April 1999:<br />
IMF Forecast (as % of GDP)<br />
1999<br />
World United States Japan Europe<br />
1998 September 2.5 2.0 0.5 2.8<br />
1999 April 2.3 3.3 -1.4 2.0<br />
1999 September 3.0 3.7 1.0 2.1<br />
2000<br />
World United States Japan Europe<br />
1999 April 3.4 2.2 0.3 2.9<br />
1999 September 3.5 2.6 1.5 2.8<br />
The Asian crisis reduced increases in trade volume <strong>to</strong> 4%<br />
in 1998 and 1999 compared <strong>to</strong> 10.5% in 1997, while<br />
the rate of deliveries of new ships rose.<br />
Freight rates in the three major shipping segments, oil<br />
tankers, dry bulk and containership transport, continued<br />
<strong>to</strong> fall. There was little optimism about the industry and<br />
greatly reduced newbuilding prices did not exert the<br />
attraction on shipowners that it did last year. Owners<br />
were beginning <strong>to</strong> wonder how long the crisis would last.<br />
First quarter <strong>orders</strong> for 1999 were so low that the year<br />
began with a spectacular plunge of 10% in the world<br />
orderbook that reached a level of 53.8 million gt in March.<br />
These gloomy prospects, coupled with continued weak<br />
demand, led some <strong>shipyards</strong> <strong>to</strong> pursue a more aggressive<br />
sales policy after April, cutting prices further and proclaiming<br />
it throughout the industry. Japanese, Korean and<br />
Chinese <strong>shipyards</strong> specialising in Handymax and<br />
Panamax bulk carrier construction pursued this course of<br />
action. They were followed shortly by others and many<br />
owners, especially in the Greek shipping community,<br />
placed <strong>orders</strong>, certainly more for opportunism than for<br />
increases in revenue.<br />
At the same time, prices on the second-hand market for<br />
these ships, after undergoing a devastating plunge,<br />
firmed up considerably. This renewed interest reversed<br />
the trend and stabilised the second quarter world orderbook<br />
at its first quarter level.<br />
This activity was <strong>to</strong> continue through the summer and<br />
was amplified by a certain firming of prices, especially in<br />
the dry bulk sec<strong>to</strong>r, which instilled in owners a feeling of<br />
urgency <strong>to</strong> take advantage of low newbuilding prices,<br />
perhaps for the last time. However, other fac<strong>to</strong>rs such as<br />
improvements in economic data, increases in demand<br />
and the need <strong>to</strong> maintain market share impelled owners<br />
<strong>to</strong> invest, especially in large containerships and in new<br />
cruiseships.<br />
The reduction in the overall pace of <strong>orders</strong> observed over<br />
the first three quarters of the year was very unbalanced<br />
compared <strong>to</strong> the same period one year earlier, depending<br />
on the region of construction. While Europe underwent<br />
a 50% drop in <strong>orders</strong> and Japan’s slide was 30%, Korea<br />
and China both recorded solid increases, with Korean<br />
<strong>shipyards</strong> augmenting <strong>orders</strong> by 25% and Chinese<br />
<strong>shipyards</strong> tripling their levels.<br />
South Western Eastern Rest of<br />
Korea Japan China Europe Europe the world Total<br />
end 1990 8.7 13.5 1.1 8.3 4.4 4.2 40.4<br />
end 1991 7.8 14.9 1.4 9.2 3.8 3.2 40.3<br />
end 1992 7.9 14.4 2.0 8.4 4.4 3.3 40.4<br />
end 1993 8.6 11.1 2.0 8.1 4.5 2.1 36.4<br />
end 1994 10.9 13.1 1.9 8.2 5.2 2.6 41.9<br />
end 1995 13.9 13.7 2.0 8.2 5.9 2.6 46.1<br />
end 1996 13.2 13.7 2.7 8.3 4.8 2.6 45.3<br />
end 1997 18.7 19.8 3.2 8.0 3.6 1.6 56.6<br />
1998 (September) 18.9 20.1 2.6 9.4 4.0 2.7 57.7<br />
1998 (December) 20.2 19.6 2.3 8.5 3.8 2.9 57.3<br />
1999 (March) 18.8 17.5 2.4 8.3 3.8 3.0 53.8<br />
1999 (June) 18.9 17.4 2.8 8.2 3.6 2.9 53.8<br />
1999 (September) 19.7 17.3 3.7 8.0 3.8 2.6 55.1<br />
Source: Lloyd’s Register