


Create successful ePaper yourself
Turn your PDF publications into a flip-book with our unique Google optimized e-Paper software.
Quarterly <strong>orders</strong> in gross <strong>to</strong>nnage (millions)<br />
South Western<br />
Japon Korea China Europe<br />
1997 March 3.875 2.585 0.500 1.001<br />
June 2.905 3.728 0.283 1.129<br />
September 2.757 3.533 0.235 0.394<br />
December 5.824 3.887 0.443 0.925<br />
1998 March 2.238 1.379 0.245 1.585<br />
June 2.648 1.741 0.241 1.040<br />
September 3.875 2.801 0.053 1.085<br />
December 2.219 2.898 0.122 0.346<br />
1999 March 1.837 1.345 0.317 0.513<br />
June 1.809 2.877 0.601 0.705<br />
September 2.265 3.199 1.400 0.733<br />
% growth:1-2-3 Qtr. 98/99 -33 % 25 % 330 % -47 %<br />
The drop in <strong>orders</strong> was also unbalanced in as much as it<br />
essentially affected, in the conventional vessel category,<br />
both Aframax and VLCC tankers, although Suezmax carriers<br />
<strong>to</strong> a lesser extent <strong>to</strong>o. Thus the percentage of vessels on<br />
order compared <strong>to</strong> the trading fleet fell.<br />
Very low freight volumes this year seemed <strong>to</strong> have braked<br />
the renewal of the tanker fleet that began in 1997. On the<br />
contrary, bulkers, from Handymax <strong>to</strong> Capesize vessels, and<br />
containerships were being rejuvenated.<br />
Bulker <strong>orders</strong> were probably more speculative this year.<br />
Owners seeking economies of scale, <strong>to</strong> maintain or increase<br />
market share or <strong>to</strong> take advantage of low construction prices<br />
spurred new <strong>orders</strong> for containerships of ever-increasing size.<br />
10,000,000<br />
9,000,000<br />
8,000,000<br />
7,000,000<br />
6,000,000<br />
5,000,000<br />
4,000,000<br />
3,000,000<br />
2,000,000<br />
1,000,000<br />
0<br />
Dwt<br />
31<br />
ships<br />
24<br />
Source: Lloyd’s Register<br />
Many <strong>orders</strong> came from German owners who wanted <strong>to</strong> take<br />
advantage of favourable tax regulations that might disappear.<br />
Specialised <strong>to</strong>nnage, inherently less speculative, was much<br />
more strongly affected by the drop in <strong>orders</strong>, with the<br />
exception of ro-ro vessels, LNG carriers and cruiseships.<br />
Cruise companies once again invested massively, but on<br />
an even greater scale than last year. The four major<br />
European <strong>shipyards</strong> that specialise in building cruiseships<br />
have an overall work load lasting through 2003, not<br />
including optional vessels. The craze for <strong>orders</strong> has resulted<br />
in such a bottleneck in producing these vessels that<br />
owners must place <strong>orders</strong> with less experienced <strong>shipyards</strong><br />
or ones whose experience dates back a very long time,<br />
like Ingalls in the US. The cruise business does closely look<br />
like the <strong>to</strong>urism industry, where supply can create intense<br />
demand. However, in shipping industry, an excess of vessels<br />
has not contributed yet <strong>to</strong> increase the volumes carried.<br />
In 1998, the drop of the Korean won against the dollar,<br />
coupled with a feeling of economic uncertainty, brought on<br />
a fall of 15 <strong>to</strong> 30% in the price of standard vessels. This slide<br />
continued in<strong>to</strong> the beginning of 1999. However, this is<br />
difficult <strong>to</strong> quantify because, as usual, supply in ship<br />
construction is heterogeneous and the requirements of<br />
<strong>shipyards</strong> were widely varied.<br />
Remember, at the end of 1998, Japan and Korea each<br />
gained around 10 million gt of <strong>orders</strong>, and about 20 million gt<br />
remaining in each of their orderbook. In general, shipbuilders<br />
in these two countries had no reason <strong>to</strong> support further<br />
cuts, especially since the won and the yen both appreciated<br />
in the last quarter.<br />
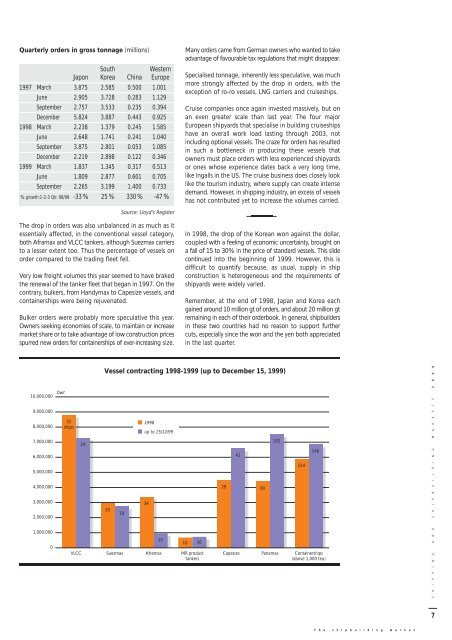
Vessel contracting 1998-1999 (up <strong>to</strong> December 15, 1999)<br />
20<br />
18<br />
1998<br />
up <strong>to</strong> 15/12/99<br />
34<br />
VLCC Suezmax Aframax<br />
10<br />
15<br />
16<br />
MR product<br />
tankers<br />
29<br />
41<br />
60<br />
102<br />
154<br />
146<br />
Capesize Panamax Containerships<br />
(above 1,000 teu)<br />
T h e s h i p b u i l d i n g m a r k e t<br />
S H I P P I N G A N D S H I P B U I L D I N G M A R K E T S 2 0 0 0<br />
7