The Unfenced Desert Towards a strategy for eco ... - Nwrc.gov.sa
The Unfenced Desert Towards a strategy for eco ... - Nwrc.gov.sa
The Unfenced Desert Towards a strategy for eco ... - Nwrc.gov.sa

Create successful ePaper yourself
Turn your PDF publications into a flip-book with our unique Google optimized e-Paper software.
esponses may exist; it is assumed here that it does not. An analysis of cumulative<br />
responses to three questions (see box) indicated that a minimum of 250-300 returns<br />
comprised a suitable <strong>sa</strong>mple size.<br />
Age of respondents ranged between 7 to 52 years, the <strong>sa</strong>mple also included<br />
responses from three teachers, aged 40, 49 and 52. <strong>The</strong> modal age <strong>for</strong> all respondents<br />
was 15; the mean 15.5 years (Figure xx).<br />
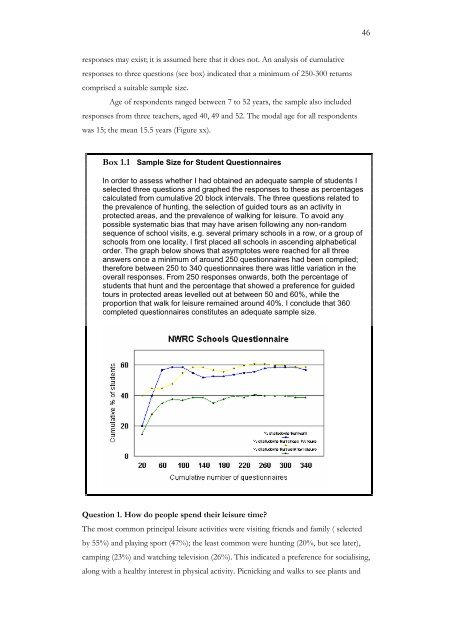
• Box 1.1 Sample Size <strong>for</strong> Student Questionnaires<br />
In order to assess whether I had obtained an adequate <strong>sa</strong>mple of students I<br />
selected three questions and graphed the responses to these as percentages<br />
calculated from cumulative 20 block intervals. <strong>The</strong> three questions related to<br />
the prevalence of hunting, the selection of guided tours as an activity in<br />
protected areas, and the prevalence of walking <strong>for</strong> leisure. To avoid any<br />
possible systematic bias that may have arisen following any non-random<br />
sequence of school visits, e.g. several primary schools in a row, or a group of<br />
schools from one locality, I first placed all schools in ascending alphabetical<br />
order. <strong>The</strong> graph below shows that asymptotes were reached <strong>for</strong> all three<br />
answers once a minimum of around 250 questionnaires had been compiled;<br />
there<strong>for</strong>e between 250 to 340 questionnaires there was little variation in the<br />
overall responses. From 250 responses onwards, both the percentage of<br />
students that hunt and the percentage that showed a preference <strong>for</strong> guided<br />
tours in protected areas levelled out at between 50 and 60%, while the<br />
proportion that walk <strong>for</strong> leisure remained around 40%. I conclude that 360<br />
completed questionnaires constitutes an adequate <strong>sa</strong>mple size.<br />
Question 1. How do people spend their leisure time?<br />
<strong>The</strong> most common principal leisure activities were visiting friends and family ( selected<br />
by 55%) and playing sport (47%); the least common were hunting (20%, but see later),<br />
camping (23%) and watching television (26%). This indicated a preference <strong>for</strong> socialising,<br />
along with a healthy interest in physical activity. Picnicking and walks to see plants and<br />
46