- Page 2: STATISTISKE ANALYSER NR. 37 MILJ Ø
- Page 5 and 6: PREFACE The Central Bureau of Stati
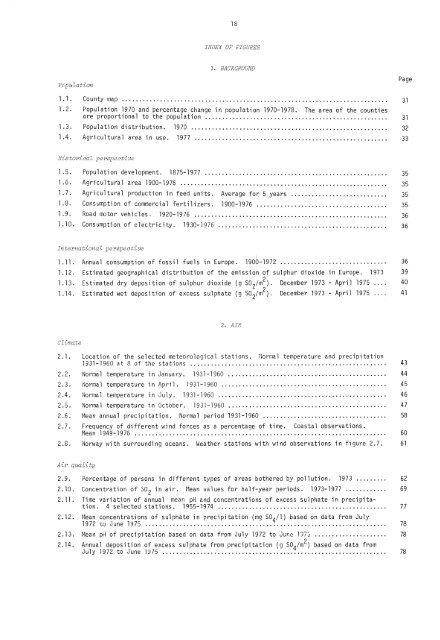
- Page 7 and 8: CONTENTS Page Index of figures 18 I
- Page 9 and 10: 8 2. LUFT (forts.) Side Radioaktivt
- Page 11 and 12: 1 0 5. PLANTELIV (forts.) Side Jord
- Page 13 and 14: 12 11. STØY Side Opplevd støy 11.
- Page 15 and 16: 14 Myr 4. AREAL (forts.) Side 4.5.
- Page 17: 16 Fossilt brensel 8. BERGGRUNN OG
- Page 21 and 22: 20 Pollution 3. WATER (cont.) Page
- Page 23 and 24: 22 7. FOOD 7.1. Domestic produced f
- Page 25 and 26: 24 3. WATER Page 3.1. Normal annual
- Page 27 and 28: 26 Livestock and reindeer 6. ANIMAL
- Page 29 and 30: 28 Oil discharge 10. EMISSIONS AND
- Page 31 and 32: 30 1. BAKGRUNN For å vurdere dagen
- Page 33 and 34: 32 FIGUR 1.3. BEFOLKNINGENS GEOGRAF
- Page 35 and 36: • 34 Tabell 1. 1. Areal, folkemen
- Page 37 and 38: 36 Figur 1.9. Motorkjoretøyer. 193
- Page 39 and 40: Tabell 1.2 (forts.). Areal, folkeme
- Page 41 and 42: 40 Figur 1.13. Beregnet ton avsetni
- Page 43 and 44: 42 2. LUFT Den blandingen av gasser
- Page 45 and 46: 44 Figur 2.2. Normaltemperatur i ja
- Page 47 and 48: 46 Figur 2.4. Normaltemperatur i ju
- Page 49 and 50: 43 Tabell 2.1. Lufttemperatur. Utva
- Page 51 and 52: Tabell 2.1 (forts.). Lufttemperatur
- Page 53 and 54: 52 Tabell 2.3 (forts.). Tallet på
- Page 55 and 56: 54 Kvaliteten på registreringene a
- Page 57 and 58: 56 Tabell 2.5 (forts.). Nedbor. Utv
- Page 59 and 60: 58 Figur 2.6. Årlig nedbor. Normal
- Page 61 and 62: , A 60 Figur 2.7. Hyppigheten av ul
- Page 63 and 64: 62 Figur 2.9. Andelen av personer s
- Page 65 and 66: 64 Tabell 2.7. Konsentrasjon av svo
- Page 67 and 68: Kommune Målested Områdetype 0806
- Page 69 and 70:
68 Tabell 2.7 (forts.). Konsentrasj
- Page 71 and 72:
70 Tabell 2.8. Konsentrasjon av sve
- Page 73 and 74:
72 Tabell 2.8 (forts.). Konsentrasj
- Page 75 and 76:
74 Tabell 2.10. KO, sentrasjon av s
- Page 77 and 78:
76 Tabell 2.10 Figur 2.11 Figur 2.1
- Page 79 and 80:
78 Figur 2.12. Middelkonsentrasjone
- Page 81 and 82:
80 Figur 2.15. Radioaktive nedfalls
- Page 83 and 84:
82 LITTERATUR Brække, F.H. (Red) (
- Page 85 and 86:
84 Figur 3.1. Normal årlig vannbal
- Page 87 and 88:
86 Tabell 3.3. Vannforing ved utval
- Page 89 and 90:
88 Figur 3.3. Månedsmidler for van
- Page 91 and 92:
, , 90 Breer Tabell I Norge er det
- Page 93 and 94:
92 Tabell 3.5. Utvalgte store innsj
- Page 95 and 96:
94 Figur 3.6. Grunnvannstand. 1975-
- Page 97 and 98:
96 Fjorder Mange norske fjorder har
- Page 99 and 100:
98 Tabell 3.10. Vannstandsobservasj
- Page 101 and 102:
100 Figur 3.8. Stromforholdene lang
- Page 103 and 104:
102 Tabell 3.11. Fysisk/kjemisk van
- Page 105 and 106:
Tabell 3.12. Gjennomsnittlig temper
- Page 107 and 108:
Innsjø Lake 4,3 Middel 66- 11,4 6,
- Page 109 and 110:
108 Tabell 3.14. Fysisk/kjemisk van
- Page 111 and 112:
110 Regionale forskjeller i vannkva
- Page 113 and 114:
112 Tabell 3.15. Regionale undersø
- Page 115 and 116:
114 Figur 3.14. pH-verdier i sno. M
- Page 117 and 118:
116 Figur 3.16. Saltholdighet i ove
- Page 119:
118 Figur 3.18. Områder der surt v
- Page 125 and 126:
124 Figur 3.24. Utbredelse av alger
- Page 127 and 128:
126 4. AREAL Landets areal gir grun
- Page 129 and 130:
Figur 4.1. Høyde over havet Height
- Page 131 and 132:
130 Arealenes egnethet til ulike fo
- Page 133 and 134:
132 Tabell 4.4. Produktivt skogarea
- Page 135 and 136:
134 Lie (1974) har anslått at om l
- Page 137 and 138:
136 Uspesifisert areal. Differensen
- Page 139 and 140:
Figur 4.3. Jordbruksareal pr. innby
- Page 141 and 142:
1 40 Figur 4.4. Hovedgrupper av are
- Page 143 and 144:
142 Tabell 4.11 Figur 4.5 Tabellen
- Page 145 and 146:
1 44 Figur 4.6. Endring i jordbruks
- Page 147 and 148:
146 Tabell 4.13 forteller ikke om a
- Page 149 and 150:
118 Arealer til boligbygg har siden
- Page 151 and 152:
150 Figur 4.10. Nasjonalparker i No
- Page 153 and 154:
152 5. PLANTELIV De fleste planter
- Page 155 and 156:
• ▪ ▪ • 154 Tabell 5.2. Bru
- Page 157 and 158:
156 Figur 5.1. Dyrket areal og avli
- Page 159 and 160:
1 58 Figur 5.5. Bruk av jordbruksar
- Page 161 and 162:
160 Figur 5.8. Eng til slått og ku
- Page 163 and 164:
162 Tabell Statistikken over forbru
- Page 165 and 166:
164 Naturlig vegetasjon Sammensetni
- Page 167 and 168:
Figur 5.12. Utbredelsen av edellauv
- Page 169 and 170:
168 Figur 5.13. Produktivt skogarea
- Page 171 and 172:
170 Figur 5.14. Skogavvirkning 1921
- Page 173 and 174:
el& , %P 1 72 Figur 5.15. Skogavvir
- Page 175 and 176:
174 Figur fylkene på figur 5.16 vi
- Page 177 and 178:
176 Nord-Trøndelag og Østlandsfyl
- Page 179 and 180:
178 6. DYRELIV Dyrelivet omfatter e
- Page 181 and 182:
180 Figur 6.1. Storfe og kyr. 1946-
- Page 183 and 184:
1 82 Figur 6.4. Svin pr. 1 000 deka
- Page 185 and 186:
184 Tabell 6.3. Storvilt- og beverj
- Page 187 and 188:
1 86 Figur 6.6. Felt elg og villrei
- Page 189 and 190:
Tabell 6.4. Felt elg. Gjennomsnitt
- Page 191 and 192:
190 Tabell 6.8. Felt småvilt. Bere
- Page 193 and 194:
192 Figur 6.9 Tabell 6.9- 6.11 I al
- Page 195 and 196:
• Tabell 6.11. Felt gaupe. Tiårs
- Page 197 and 198:
196 Rovfugl Tabell 6.13 Bruk av sku
- Page 199 and 200:
198 Tabell 6.14. Totalt oppfisket k
- Page 201 and 202:
200 Figur 6.12. Utbytte av sjøfisk
- Page 203 and 204:
202 Figur 6.13. Bestand og dodeligh
- Page 205 and 206:
204 Figur 6.14. Bestand og gytebest
- Page 207 and 208:
206 Figur 7.1. Norskproduserte matv
- Page 209 and 210:
208 Figur 7.2. Sammensetningen av m
- Page 211 and 212:
Tabell 7.2 (forts.). Tilgang og for
- Page 213 and 214:
212 Figur 7.3. Årlig forbruk pr. i
- Page 215 and 216:
214 Tabell 8.1. De mest utbredte be
- Page 217:
216 Tabell 8.2. Reserver av de vikt
- Page 223 and 224:
Tabell 8.4. Utvinning av industrimi
- Page 225 and 226:
224 Figur 8.4. Utvinnbare petroleum
- Page 227 and 228:
226 Figur 8.5. Tilstedeværendel) o
- Page 229 and 230:
228 Tabell 9.1. Energivarebalanse.
- Page 231 and 232:
Tabell 9.2. Netto sluttforbruk av e
- Page 233 and 234:
232 Tabell 9.3. Energibalanse'' . 1
- Page 235 and 236:
234 Tabell 9.5. Totalt energiforbru
- Page 237 and 238:
' 236 Tabell 9.8. Salg av enkelte p
- Page 239 and 240:
238 Vannkraft og elektrisitet Figur
- Page 241 and 242:
240 Figur 9.4. Nyttbar og utbygd va
- Page 243:
242 Tabell 9.12. Reguleringsmagasin
- Page 246 and 247:
1 245 Figur 9.6. Forbruk av elektri
- Page 248 and 249:
247 10. EMISJON OG GJENVINNING Med
- Page 250 and 251:
249 Tabell 10.2. Emisjon til luft f
- Page 252 and 253:
251 Tabell 10.4 (forts.). Vannforbr
- Page 254 and 255:
253 EMissions to water from mining
- Page 256 and 257:
255 Tabell 10.6. Emisjon til vann f
- Page 258 and 259:
- 257 Public waste water treatment
- Page 260 and 261:
259 Tabell 10.9. Emisjon fra bergve
- Page 262 and 263:
Tabell 10.12. Fast avfall fra bergv
- Page 265 and 266:
264 Tabell 10.16. Sammensetning av
- Page 267 and 268:
266 Tabell 10.17. Sammensetning av
- Page 269 and 270:
268 Tabell A/S Vinmonopolet har ikk
- Page 271 and 272:
270 LITTERATUR Arbeidsgruppe ved No
- Page 273 and 274:
272 Figur 11.1. Andelen av husholdn
- Page 275 and 276:
274 Maling av støy Lydens nivå, f
- Page 277 and 278:
9 7 6 Figur 11.6. Personer utsatt f
- Page 279 and 280:
278 Tabell 11.1. Folketall 1970 omk
- Page 281 and 282:
280 Tabell 11.2 (forts.). Personer
- Page 283 and 284:
282 Figur 12.2. Omkomne ved skred.
- Page 285 and 286:
284 Tabell 12.2. Naturskader. Skade
- Page 287 and 288:
286 Viltskader Tabell Enkelte viTtl
- Page 289 and 290:
288 Skog- og utmarksbranner Tabell
- Page 291 and 292:
290 Chapter 4 on Area. In addition
- Page 293 and 294:
292 I serien Norges offisielle stat
- Page 295 and 296:
294 Rekke A Offsettrykk 1978 (forts
- Page 297:
296 Utvalgte publikasjoner i serien