

Miljøstatistikk 1978: Naturressurser og forurensninger - SSB
Miljøstatistikk 1978: Naturressurser og forurensninger - SSB
Miljøstatistikk 1978: Naturressurser og forurensninger - SSB

You also want an ePaper? Increase the reach of your titles
YUMPU automatically turns print PDFs into web optimized ePapers that Google loves.
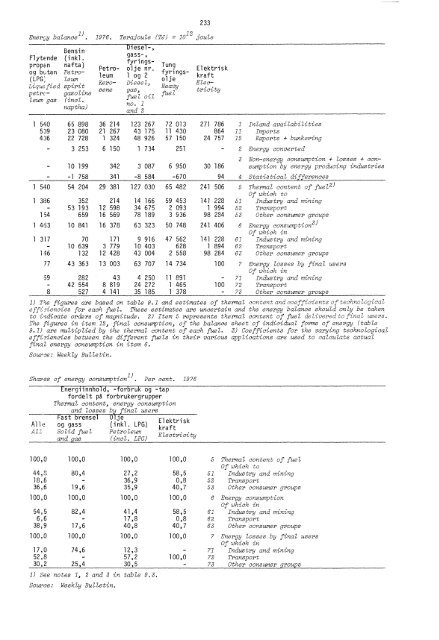
Energy balance 1)<br />
Bensin<br />
Flytende (inkl.<br />
propan nafta)<br />
<strong>og</strong> butan Petro-<br />
(LPG: Zeum<br />
Liquefied spirit<br />
petro- gasoline<br />
leum gas (incl.<br />
naptha)<br />
233<br />
1976. Terajoule (Tel) = 10 12 joule<br />
Diesel-,<br />
gass-,<br />
fyrings- Tung<br />
Petro- olje nr. Elektrisk<br />
fyringsleum<br />
1 <strong>og</strong> 2 kraft<br />
olje<br />
Kero- Diesel,<br />
Elec-<br />
Heavy<br />
sene gas,<br />
tricity<br />
fuel oil fuel<br />
no. 1<br />
and 2<br />
1 540 65 898 36 214 123 267 72 013 271 786 1 Inland availabilities<br />
539 23 080 21 267 43 175 11 430 864 11 Imports<br />
436 22 728 1 324 48 926 57 150 24 757 12 Exports + bunkering<br />
- 3 253 6 150 1 734 251 - 2 Energy converted<br />
3 Non-energy consumption + losses + con-<br />
- 10 199 342 3 087 6 950 30 186 sumption by energy producing industries<br />
- -1 758 341 -8 584 -670 94 4 Statistical differences<br />
1 540 54 204 29 381 127 030 65 482 241 506 5 Thermal content of fuel 2)<br />
Of which to<br />
1 386 352 214 14 166 59 453 141 228 51 Industry and mining<br />
- 53 193 12 598 34 675 2 093 1 994 52 Transport<br />
154 659 16 569 78 189 3 936 98 284 53 Other consumer groups<br />
1 463 10 841 16 378 63 323 50 748 241 406 6 Energy consumption3)<br />
Of which in<br />
1 317 70 171 9 916 47 562 141 228 61 Industry and mining<br />
- 10 639 3 779 10 403 628 1 894 62 Transport<br />
146 132 12 428 43 004 2 558 98 284 63 Other consumer groups<br />
77 43 363 13 003 63 707 14 734 100 7 Energy losses by final users<br />
Of which in<br />
59 282 43 4 250 11 891 - 71 Industry and mining<br />
- 42 554 8 819 24 272 1 465 100 72 Transport<br />
8 527 4 141 35 185 1 378 - 73 Other consumer groups<br />
1) ne figures are based on table 9.1 and estimates of thermal contentandcoefficientsoftechnol<strong>og</strong>ical<br />
efficiencies for each fuel. These estimates are uncertain and the energy balance should only be taken<br />
to ildicate orders of magnitude. 2) Item 5 represents thermal content of fuel delivered to final users.<br />
The figures in item 12, final consumption, of the balance sheet of indiciduaZ forms of energy (table<br />
9.1) are multiplied by the thermal content of each fuel. 3) Coefficients for the varying technol<strong>og</strong>ical<br />
efficiencies between the different fuels in their various applications are used to calculate actual<br />
final energy consumption in item 6.<br />
Source: Weekly Bulletin.<br />
Shares of energy consumption. Per cent. 1976<br />
Energiinnfiold, -forbruk <strong>og</strong> -tap<br />
fordelt på forbrukergrupper<br />
Thermal content, energy consumption<br />
and losses by final users<br />
Fast brensel Olje<br />
Elektrisk<br />
Alle <strong>og</strong> gass (inkl. LPG)<br />
kraft<br />
Ali Solid fuel Petroleum<br />
LPG) Electricity<br />
and gas (incl.<br />
100,0 100,0 100,0 100,0 5 Thermal content of fuel<br />
Of which to<br />
44,8 80,4 27,2 58,5 51 Industry and mining<br />
18,6 - 36,9 0,8 52 Transport<br />
36,6 19,6 35,9 40,7 53 Other consumer groups<br />
100,0 100,0 100,0 100,0 6 Energy consumption<br />
Of which in<br />
54,5 82,4 41,4 58,5 61 Industry and mining<br />
6,6 - 17,8 0,8 62 Transport<br />
38,9 17,6 40,8 40,7 63 Other consumer groups<br />
100,0 100,0 100,0 100,0 7 Energy losses by final users<br />
Of which in<br />
17,0 74,6 12,3 - 71 Industry and mining<br />
52,8 - 57,2 100,0 72 Transport<br />
30,2 25,4 30,5 - 73 Other consumer groups<br />
1) See notes 1, 2 and 3 in table 9.3.<br />
Source: Weekly Bulletin.


