TOMO I - VOL. 1 - Diagnóstico - Governo do Estado de Pernambuco
TOMO I - VOL. 1 - Diagnóstico - Governo do Estado de Pernambuco
TOMO I - VOL. 1 - Diagnóstico - Governo do Estado de Pernambuco

Create successful ePaper yourself
Turn your PDF publications into a flip-book with our unique Google optimized e-Paper software.
Definições <strong>de</strong> açu<strong>de</strong>s<br />
a) Açu<strong>de</strong>s interanuais<br />
Foram consi<strong>de</strong>ra<strong>do</strong>s açu<strong>de</strong>s interanuais aqueles com volumes superiores a 100.000<br />
m³. Foram feitas simulações <strong>de</strong> operação em to<strong>do</strong>s aqueles com volumes acima <strong>de</strong><br />
10.000.000 m 3 e em alguns com volumes menores, em função das características <strong>de</strong><br />
cada bacia e da existência <strong>de</strong> da<strong>do</strong>s contínuos.<br />
b) Açu<strong>de</strong>s anuais<br />
Os açu<strong>de</strong>s anuais são reservatórios <strong>de</strong> pouca profundida<strong>de</strong>, em sua maioria<br />
apresentan<strong>do</strong> profundida<strong>de</strong>s médias inferiores a 3,00m, o que na região semi-árida,<br />
acarretaria o seu esvaziamento, somente com a evaporação. Para tanto, foi a<strong>do</strong>ta<strong>do</strong>,<br />
o valor <strong>de</strong> 100.000m 3 , como limite <strong>de</strong> volume <strong>de</strong> acumulação para esses<br />
reservatórios.<br />
Conforme o PERH/PE, as disponibilida<strong>de</strong>s estimadas para os açu<strong>de</strong>s anuais, estão<br />
baseadas em simulações <strong>de</strong> operação efetuadas em amostras <strong>de</strong> reservatórios<br />
<strong>de</strong>sse porte. Para os rios <strong>de</strong> bacias litorâneas, perenes, com reservatórios <strong>de</strong><br />
capacida<strong>de</strong> inferior a 500.000m 3 , as disponibilida<strong>de</strong>s <strong>do</strong>s mesmos serão<br />
consi<strong>de</strong>radas <strong>de</strong> regularização interanual.<br />
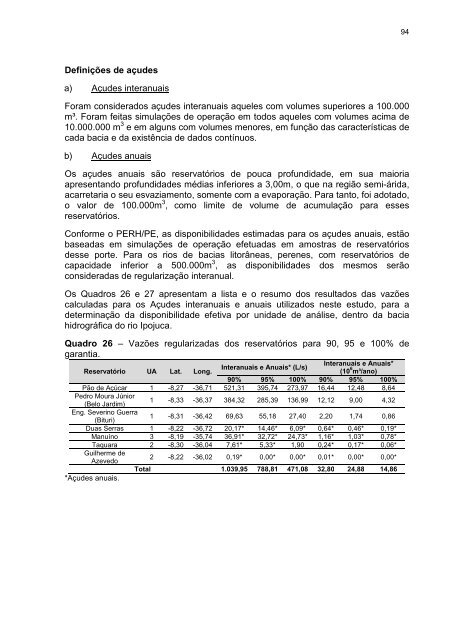
Os Quadros 26 e 27 apresentam a lista e o resumo <strong>do</strong>s resulta<strong>do</strong>s das vazões<br />
calculadas para os Açu<strong>de</strong>s interanuais e anuais utiliza<strong>do</strong>s neste estu<strong>do</strong>, para a<br />
<strong>de</strong>terminação da disponibilida<strong>de</strong> efetiva por unida<strong>de</strong> <strong>de</strong> análise, <strong>de</strong>ntro da bacia<br />
hidrográfica <strong>do</strong> rio Ipojuca.<br />
Quadro 26 – Vazões regularizadas <strong>do</strong>s reservatórios para 90, 95 e 100% <strong>de</strong><br />
garantia.<br />
Reservatório UA Lat. Long.<br />
Interanuais e Anuais* (L/s)<br />
Interanuais e Anuais*<br />
(10 6 m³/ano)<br />
90% 95% 100% 90% 95% 100%<br />
Pão <strong>de</strong> Açúcar 1 -8,27 -36,71 521,31 395,74 273,97 16,44 12,48 8,64<br />
Pedro Moura Júnior<br />
(Belo Jardim)<br />
1 -8,33 -36,37 384,32 285,39 136,99 12,12 9,00 4,32<br />
Eng. Severino Guerra<br />
(Bituri)<br />
1 -8,31 -36,42 69,63 55,18 27,40 2,20 1,74 0,86<br />
Duas Serras 1 -8,22 -36,72 20,17* 14,46* 6,09* 0,64* 0,46* 0,19*<br />
Manuíno 3 -8,19 -35,74 36,91* 32,72* 24,73* 1,16* 1,03* 0,78*<br />
Taquara 2 -8,30 -36,04 7,61* 5,33* 1,90 0,24* 0,17* 0,06*<br />
Guilherme <strong>de</strong><br />
Azeve<strong>do</strong><br />
2 -8,22 -36,02 0,19* 0,00* 0,00* 0,01* 0,00* 0,00*<br />
Total 1.039,95 788,81 471,08 32,80 24,88 14,86<br />
*Açu<strong>de</strong>s anuais.<br />
94