- Page 2 and 3:
Nanotechnology-Enabled Sensors
- Page 4 and 5:
Kourosh Kalantar-zadeh RMIT Univers
- Page 6 and 7:
Acknowledgments We have been fortun
- Page 8 and 9:
viii Contents Chapter 3: Transducti
- Page 10 and 11:
x Contents 5.7.1 Scanning Electron
- Page 12 and 13:
xii Contents 7.5 Nano-sensors based
- Page 14 and 15:
2 Chapter 1: Introduction Nobel lau
- Page 16 and 17:
4 Chapter 1: Introduction Fig. 1.2
- Page 18 and 19:
6 Chapter 1: Introduction ensure th
- Page 20 and 21:
8 Chapter 1: Introduction ments, th
- Page 22 and 23:
10 Chapter 1: Introduction aim is t
- Page 24 and 25:
12 Chapter 1: Introduction Referenc
- Page 26 and 27:
14 Chapter 2: Sensor Characteristic
- Page 28 and 29:
16 Chapter 2: Sensor Characteristic
- Page 30 and 31:
18 Chapter 2: Sensor Characteristic
- Page 32 and 33:
20 Chapter 2: Sensor Characteristic
- Page 34 and 35:
22 Chapter 2: Sensor Characteristic
- Page 36 and 37:
24 Chapter 2: Sensor Characteristic
- Page 38 and 39:
26 Chapter 2: Sensor Characteristic
- Page 40 and 41:
28 Chapter 2: Sensor Characteristic
- Page 42 and 43:
30 Chapter 2: Sensor Characteristic
- Page 44 and 45:
32 Chapter 2: Sensor Characteristic
- Page 46 and 47:
34 Chapter 2: Sensor Characteristic
- Page 48 and 49:
36 Chapter 2: Sensor Characteristic
- Page 50 and 51:
38 Chapter 2: Sensor Characteristic
- Page 52 and 53:
40 Chapter 2: Sensor Characteristic
- Page 54 and 55:
42 Chapter 2: Sensor Characteristic
- Page 56 and 57:
44 Chapter 2: Sensor Characteristic
- Page 58 and 59:
46 Chapter 2: Sensor Characteristic
- Page 60 and 61:
48 Chapter 2: Sensor Characteristic
- Page 62 and 63:
50 Chapter 2: Sensor Characteristic
- Page 64 and 65:
52 Chapter 2: Sensor Characteristic
- Page 66 and 67:
54 Chapter 2: Sensor Characteristic
- Page 68 and 69:
56 Chapter 2: Sensor Characteristic
- Page 70 and 71:
58 Chapter 2: Sensor Characteristic
- Page 72 and 73:
60 Chapter 2: Sensor Characteristic
- Page 74 and 75:
62 Chapter 2: Sensor Characteristic
- Page 76 and 77:
64 Chapter 3: Transduction Platform
- Page 78 and 79:
66 Chapter 3: Transduction Platform
- Page 80 and 81:
68 Chapter 3: Transduction Platform
- Page 82 and 83:
70 Chapter 3: Transduction Platform
- Page 84 and 85:
72 Chapter 3: Transduction Platform
- Page 86 and 87:
74 Chapter 3: Transduction Platform
- Page 88 and 89:
76 Chapter 3: Transduction Platform
- Page 90 and 91:
78 Chapter 3: Transduction Platform
- Page 92 and 93:
80 Chapter 3: Transduction Platform
- Page 94 and 95:
82 Chapter 3: Transduction Platform
- Page 96 and 97:
84 Chapter 3: Transduction Platform
- Page 98 and 99:
86 Chapter 3: Transduction Platform
- Page 100 and 101:
88 Chapter 3: Transduction Platform
- Page 102 and 103:
90 Chapter 3: Transduction Platform
- Page 104 and 105:
92 Chapter 3: Transduction Platform
- Page 106 and 107:
94 Chapter 3: Transduction Platform
- Page 108 and 109:
96 Chapter 3: Transduction Platform
- Page 110 and 111:
98 Chapter 3: Transduction Platform
- Page 112 and 113:
100 Chapter 3: Transduction Platfor
- Page 114 and 115:
102 Chapter 3: Transduction Platfor
- Page 116 and 117:
104 Chapter 3: Transduction Platfor
- Page 118 and 119:
106 Chapter 3: Transduction Platfor
- Page 120 and 121:
108 Chapter 3: Transduction Platfor
- Page 122 and 123:
110 Chapter 3: Transduction Platfor
- Page 124 and 125:
112 Chapter 3: Transduction Platfor
- Page 126 and 127:
114 Chapter 3: Transduction Platfor
- Page 128 and 129:
116 Chapter 3: Transduction Platfor
- Page 130 and 131:
118 Chapter 3: Transduction Platfor
- Page 132 and 133:
120 Chapter 3: Transduction Platfor
- Page 134 and 135:
122 Chapter 3: Transduction Platfor
- Page 136 and 137:
124 Chapter 3: Transduction Platfor
- Page 138 and 139:
126 Chapter 3: Transduction Platfor
- Page 140 and 141:
128 Chapter 3: Transduction Platfor
- Page 142 and 143:
130 Chapter 3: Transduction Platfor
- Page 144 and 145:
132 Chapter 3: Transduction Platfor
- Page 146 and 147:
134 Chapter 3: Transduction Platfor
- Page 148 and 149:
136 Chapter 4: Nano Fabrication and
- Page 150 and 151:
138 Chapter 4: Nano Fabrication and
- Page 152 and 153:
140 Chapter 4: Nano Fabrication and
- Page 154 and 155:
142 Chapter 4: Nano Fabrication and
- Page 156 and 157:
144 Chapter 4: Nano Fabrication and
- Page 158 and 159:
146 Chapter 4: Nano Fabrication and
- Page 160 and 161:
148 Chapter 4: Nano Fabrication and
- Page 162 and 163:
150 Chapter 4: Nano Fabrication and
- Page 164 and 165:
152 Chapter 4: Nano Fabrication and
- Page 166 and 167:
154 Chapter 4: Nano Fabrication and
- Page 168 and 169:
156 Chapter 4: Nano Fabrication and
- Page 170 and 171:
158 Chapter 4: Nano Fabrication and
- Page 172 and 173:
160 Chapter 4: Nano Fabrication and
- Page 174 and 175:
162 Chapter 4: Nano Fabrication and
- Page 176 and 177:
164 Chapter 4: Nano Fabrication and
- Page 178 and 179:
166 Chapter 4: Nano Fabrication and
- Page 180 and 181:
168 Chapter 4: Nano Fabrication and
- Page 182 and 183:
170 Chapter 4: Nano Fabrication and
- Page 184 and 185:
172 Chapter 4: Nano Fabrication and
- Page 186 and 187:
174 Chapter 4: Nano Fabrication and
- Page 188 and 189:
176 Chapter 4: Nano Fabrication and
- Page 190 and 191:
178 Chapter 4: Nano Fabrication and
- Page 192 and 193:
180 Chapter 4: Nano Fabrication and
- Page 194 and 195:
182 Chapter 4: Nano Fabrication and
- Page 196 and 197:
184 Chapter 4: Nano Fabrication and
- Page 198 and 199:
186 Chapter 4: Nano Fabrication and
- Page 200 and 201:
188 Chapter 4: Nano Fabrication and
- Page 202 and 203:
190 Chapter 4: Nano Fabrication and
- Page 204 and 205:
192 Chapter 4: Nano Fabrication and
- Page 206 and 207:
194 Chapter 4: Nano Fabrication and
- Page 208 and 209:
196 Chapter 4: Nano Fabrication and
- Page 210 and 211:
198 Chapter 4: Nano Fabrication and
- Page 212 and 213:
200 Chapter 4: Nano Fabrication and
- Page 214 and 215:
202 Chapter 4: Nano Fabrication and
- Page 216 and 217:
204 Chapter 4: Nano Fabrication and
- Page 218 and 219:
206 Chapter 4: Nano Fabrication and
- Page 220 and 221:
208 Chapter 4: Nano Fabrication and
- Page 222 and 223:
210 Chapter 4: Nano Fabrication and
- Page 224 and 225:
212 Chapter 5: Characterization Tec
- Page 226 and 227:
214 Chapter 5: Characterization Tec
- Page 228 and 229:
216 Chapter 5: Characterization Tec
- Page 230 and 231:
218 Chapter 5: Characterization Tec
- Page 232 and 233: 220 Chapter 5: Characterization Tec
- Page 234 and 235: 222 Chapter 5: Characterization Tec
- Page 236 and 237: 224 Chapter 5: Characterization Tec
- Page 238 and 239: 226 Chapter 5: Characterization Tec
- Page 240 and 241: 228 Chapter 5: Characterization Tec
- Page 242 and 243: 230 Chapter 5: Characterization Tec
- Page 244 and 245: 232 Chapter 5: Characterization Tec
- Page 246 and 247: 234 Chapter 5: Characterization Tec
- Page 248 and 249: 236 Chapter 5: Characterization Tec
- Page 250 and 251: 238 Chapter 5: Characterization Tec
- Page 252 and 253: 240 Chapter 5: Characterization Tec
- Page 254 and 255: 242 Chapter 5: Characterization Tec
- Page 256 and 257: 244 Chapter 5: Characterization Tec
- Page 258 and 259: 246 Chapter 5: Characterization Tec
- Page 260 and 261: 248 Chapter 5: Characterization Tec
- Page 262 and 263: 250 Chapter 5: Characterization Tec
- Page 264 and 265: 252 Chapter 5: Characterization Tec
- Page 266 and 267: 254 Chapter 5: Characterization Tec
- Page 268 and 269: 256 Chapter 5: Characterization Tec
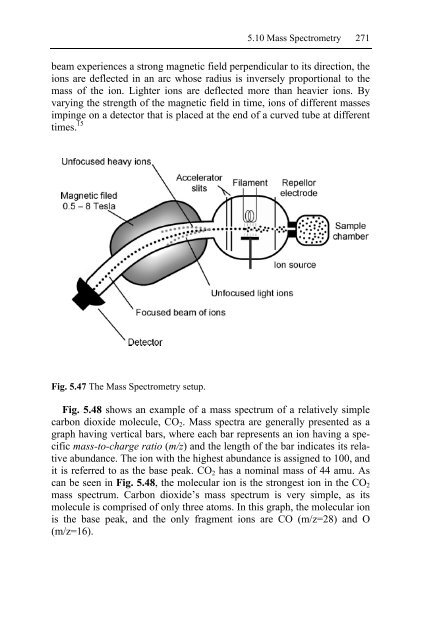
- Page 270 and 271: 258 Chapter 5: Characterization Tec
- Page 272 and 273: 260 Chapter 5: Characterization Tec
- Page 274 and 275: 262 Chapter 5: Characterization Tec
- Page 276 and 277: 264 Chapter 5: Characterization Tec
- Page 278 and 279: 266 Chapter 5: Characterization Tec
- Page 280 and 281: 268 Chapter 5: Characterization Tec
- Page 284 and 285: 272 Chapter 5: Characterization Tec
- Page 286 and 287: 274 Chapter 5: Characterization Tec
- Page 288 and 289: 276 Chapter 5: Characterization Tec
- Page 290 and 291: 278 Chapter 5: Characterization Tec
- Page 292 and 293: 280 Chapter 5: Characterization Tec
- Page 294 and 295: Chapter 6: Inorganic Nanotechnology
- Page 296 and 297: 6.2 Density and Number of States 28
- Page 298 and 299: 6.2 Density and Number of States 28
- Page 300 and 301: 6.2 Density and Number of States 28
- Page 302 and 303: 2 6.2 Density and Number of States
- Page 304 and 305: 6.2 Density and Number of States 29
- Page 306 and 307: 6.2 Density and Number of States 29
- Page 308 and 309: 6.2 Density and Number of States 29
- Page 310 and 311: 6.2 Density and Number of States 29
- Page 312 and 313: 6.2 Density and Number of States 30
- Page 314 and 315: 6.2 Density and Number of States 30
- Page 316 and 317: 6.3 Gas Sensing with Nanostructured
- Page 318 and 319: 6.3 Gas Sensing with Nanostructured
- Page 320 and 321: 6.3 Gas Sensing with Nanostructured
- Page 322 and 323: 6.3 Gas Sensing with Nanostructured
- Page 324 and 325: 6.3 Gas Sensing with Nanostructured
- Page 326 and 327: 6.3 Gas Sensing with Nanostructured
- Page 328 and 329: 6.3 Gas Sensing with Nanostructured
- Page 330 and 331: 6.3 Gas Sensing with Nanostructured
- Page 332 and 333:
6.3 Gas Sensing with Nanostructured
- Page 334 and 335:
6.3 Gas Sensing with Nanostructured
- Page 336 and 337:
6.3.7 Surface Modification 6.3 Gas
- Page 338 and 339:
6.3 Gas Sensing with Nanostructured
- Page 340 and 341:
6.3 Gas Sensing with Nanostructured
- Page 342 and 343:
This is the dispersion relation for
- Page 344 and 345:
6.4 Phonons in Low Dimensional Stru
- Page 346 and 347:
335 vibrational degrees of freedom
- Page 348 and 349:
337 ing ballistic transport of elec
- Page 350 and 351:
339 Fig. 6.36 Nanoresonators made o
- Page 352 and 353:
6.5 Nanotechnology Enabled Mechanic
- Page 354 and 355:
6.5 Nanotechnology Enabled Mechanic
- Page 356 and 357:
6.5 Nanotechnology Enabled Mechanic
- Page 358 and 359:
6.5 Nanotechnology Enabled Mechanic
- Page 360 and 361:
6.6 Nanotechnology Enabled Optical
- Page 362 and 363:
6.6 Nanotechnology Enabled Optical
- Page 364 and 365:
6.6 Nanotechnology Enabled Optical
- Page 366 and 367:
6.6 Nanotechnology Enabled Optical
- Page 368 and 369:
6.7 Magnetically Engineered Spintro
- Page 370 and 371:
6.7 Magnetically Engineered Spintro
- Page 372 and 373:
6.7 Magnetically Engineered Spintro
- Page 374 and 375:
ferromagnetic haematite (a form of
- Page 376 and 377:
References 365 21 E. Comini, G. Fag
- Page 378 and 379:
References 367 58 D. E. Williams an
- Page 380 and 381:
References 369 96 J. J. Shi, Y. F.
- Page 382 and 383:
Chapter 7: Organic Nanotechnology E
- Page 384 and 385:
7.2 Surface Interactions 373 can be
- Page 386 and 387:
7.2 Surface Interactions 375 Carbox
- Page 388 and 389:
7.2 Surface Interactions 377 Fig. 7
- Page 390 and 391:
7.2 Surface Interactions 379 There
- Page 392 and 393:
Fig. 7.12 The schematic of physical
- Page 394 and 395:
Fig. 7.13 Formation of SAMs. 7.2 Su
- Page 396 and 397:
7.2 Surface Interactions 385 ple, t
- Page 398 and 399:
7.3 Surface Materials and Surface M
- Page 400 and 401:
7.3 Surface Materials and Surface M
- Page 402 and 403:
7.3 Surface Materials and Surface M
- Page 404 and 405:
7.3 Surface Materials and Surface M
- Page 406 and 407:
7.3 Surface Materials and Surface M
- Page 408 and 409:
7.3 Surface Materials and Surface M
- Page 410 and 411:
7.3 Surface Materials and Surface M
- Page 412 and 413:
7.3 Surface Materials and Surface M
- Page 414 and 415:
7.3 Surface Materials and Surface M
- Page 416 and 417:
7.4 Proteins in Nanotechnology Enab
- Page 418 and 419:
7.4 Proteins in Nanotechnology Enab
- Page 420 and 421:
7.4 Proteins in Nanotechnology Enab
- Page 422 and 423:
7.4.4 Using Proteins as Nanodevices
- Page 424 and 425:
Fig. 7.36 The general structure of
- Page 426 and 427:
7.4 Proteins in Nanotechnology Enab
- Page 428 and 429:
7.4 Proteins in Nanotechnology Enab
- Page 430 and 431:
7.4 Proteins in Nanotechnology Enab
- Page 432 and 433:
7.4 Proteins in Nanotechnology Enab
- Page 434 and 435:
7.4 Proteins in Nanotechnology Enab
- Page 436 and 437:
7.4 Proteins in Nanotechnology Enab
- Page 438 and 439:
+ 7.4 Proteins in Nanotechnology En
- Page 440 and 441:
7.4 Proteins in Nanotechnology Enab
- Page 442 and 443:
7.4 Proteins in Nanotechnology Enab
- Page 444 and 445:
7.4 Proteins in Nanotechnology Enab
- Page 446 and 447:
7.4 Proteins in Nanotechnology Enab
- Page 448 and 449:
7.5 Nano-sensors based on Nucleotid
- Page 450 and 451:
Fig. 7.57 The structure of DNA stra
- Page 452 and 453:
7.5 Nano-sensors based on Nucleotid
- Page 454 and 455:
7.5 Nano-sensors based on Nucleotid
- Page 456 and 457:
7.5 Nano-sensors based on Nucleotid
- Page 458 and 459:
7.5 Nano-sensors based on Nucleotid
- Page 460 and 461:
7.5 Nano-sensors based on Nucleotid
- Page 462 and 463:
7.5 Nano-sensors based on Nucleotid
- Page 464 and 465:
7.5 Nano-sensors based on Nucleotid
- Page 466 and 467:
7.5 Nano-sensors based on Nucleotid
- Page 468 and 469:
7.5 Nano-sensors based on Nucleotid
- Page 470 and 471:
7.5 Nano-sensors based on Nucleotid
- Page 472 and 473:
7.5 Nano-sensors based on Nucleotid
- Page 474 and 475:
7.5 Nano-sensors based on Nucleotid
- Page 476 and 477:
7.6 Sensors Based on Molecules with
- Page 478 and 479:
7.6 Sensors Based on Molecules with
- Page 480 and 481:
7.8 Biomagnetic Sensors 7.8 Biomagn
- Page 482 and 483:
7.9 Summary 471 metal oxides, carbo
- Page 484 and 485:
References 473 19 T. Kunitake, Ange
- Page 486 and 487:
63 J. X. Huang, S. Virji, B. H. Wei
- Page 488 and 489:
References 477 105 M. Plomer, G. G.
- Page 490 and 491:
References 479 145 R. F. Service, S
- Page 492 and 493:
7.8 References 481 185 J. Wang, D.
- Page 494 and 495:
Remote plasma enhanced CVD (RPECVD)
- Page 496 and 497:
Thin film equivalent circuit ... 32
- Page 498 and 499:
Optical waveguides ................
- Page 500 and 501:
Semiconductor-semiconductor junctio
- Page 502:
About the Authors Dr. Kourosh Kalan