Munich Re Group Annual Report 2006 (PDF, 1.8
Munich Re Group Annual Report 2006 (PDF, 1.8
Munich Re Group Annual Report 2006 (PDF, 1.8

You also want an ePaper? Increase the reach of your titles
YUMPU automatically turns print PDFs into web optimized ePapers that Google loves.
<strong>Munich</strong> <strong>Re</strong> <strong>Group</strong> <strong>Annual</strong> <strong>Re</strong>port <strong>2006</strong><br />
Consolidated financial statements<br />
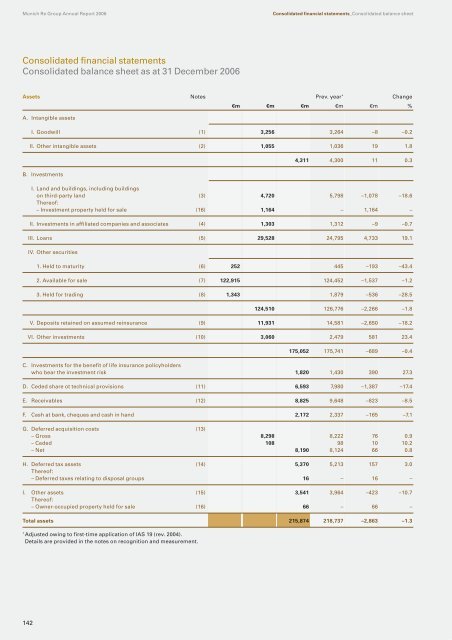
Consolidated balance sheet as at 31 December <strong>2006</strong><br />
142<br />
Consolidated financial statements_Consolidated balance sheet<br />
Assets Notes Prev. year * Change<br />
€m €m €m €m €m %<br />
A. Intangible assets<br />
I. Goodwill (1) 3,256 3,264 –8 –0.2<br />
II. Other intangible assets (2) 1,055 1,036 19 <strong>1.8</strong><br />
B. Investments<br />
4,311 4,300 11 0.3<br />
I. Land and buildings, including buildings<br />
on third-party land (3) 4,720 5,798 –1,078 –18.6<br />
Thereof:<br />
– Investment property held for sale (16) 1,164 – 1,164 –<br />
II. Investments in affiliated companies and associates (4) 1,303 1,312 –9 –0.7<br />
III. Loans (5) 29,528 24,795 4,733 19.1<br />
IV. Other securities<br />
1. Held to maturity (6) 252 445 –193 –43.4<br />
2. Available for sale (7) 122,915 124,452 –1,537 –1.2<br />
3. Held for trading (8) 1,343 1,879 –536 –28.5<br />
124,510 126,776 –2,266 –<strong>1.8</strong><br />
V. Deposits retained on assumed reinsurance (9) 11,931 14,581 –2,650 –18.2<br />
VI. Other investments (10) 3,060 2,479 581 23.4<br />
175,052 175,741 –689 –0.4<br />
C. Investments for the benefit of life insurance policyholders<br />
who bear the investment risk 1,820 1,430 390 27.3<br />
D. Ceded share ot technical provisions (11) 6,593 7,980 –1,387 –17.4<br />
E. <strong>Re</strong>ceivables (12) 8,825 9,648 –823 –8.5<br />
F. Cash at bank, cheques and cash in hand 2,172 2,337 –165 –7.1<br />
G. Deferred acquisition costs (13)<br />
– Gross 8,298 8,222 76 0.9<br />
– Ceded 108 98 10 10.2<br />
– Net 8,190 8,124 66 0.8<br />
H. Deferred tax assets (14) 5,370 5,213 157 3.0<br />
Thereof:<br />
– Deferred taxes relating to disposal groups 16 – 16 –<br />
I. Other assets (15) 3,541 3,964 –423 –10.7<br />
Thereof:<br />
– Owner-occupied property held for sale (16) 66 – 66 –<br />
Total assets 215,874 218,737 –2,863 –1.3<br />
* Adjusted owing to first-time application of IAS 19 (rev. 2004).<br />
Details are provided in the notes on recognition and measurement.