Munich Re Group Annual Report 2006 (PDF, 1.8
Munich Re Group Annual Report 2006 (PDF, 1.8
Munich Re Group Annual Report 2006 (PDF, 1.8

Create successful ePaper yourself
Turn your PDF publications into a flip-book with our unique Google optimized e-Paper software.
<strong>Munich</strong> <strong>Re</strong> <strong>Group</strong> <strong>Annual</strong> <strong>Re</strong>port <strong>2006</strong> Notes_Notes to the consolidated balance sheet – Equity and liabilities<br />
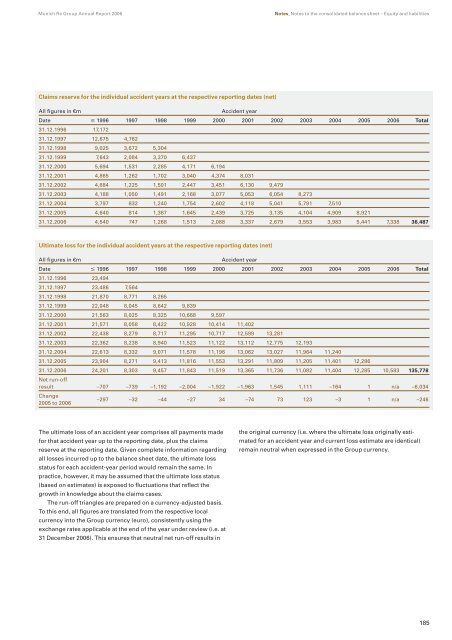
Claims reserve for the individual accident years at the respective reporting dates (net)<br />
All figures in €m Accident year<br />
Date 1996 1997 1998 1999 2000 2001 2002 2003 2004 2005 <strong>2006</strong> Total<br />
31.12.1996 17,172<br />
31.12.1997 12,675 4,762<br />
31.12.1998 9,025 3,672 5,304<br />
31.12.1999 7,643 2,084 3,370 6,437<br />
31.12.2000 5,694 1,531 2,285 4,171 6,194<br />
31.12.2001 4,865 1,262 1,702 3,040 4,374 8,031<br />
31.12.2002 4,884 1,225 1,501 2,447 3,451 6,130 9,479<br />
31.12.2003 4,188 1,050 1,491 2,168 3,077 5,053 6,054 8,273<br />
31.12.2004 3,797 832 1,240 1,754 2,602 4,118 5,041 5,791 7,510<br />
31.12.2005 4,640 814 1,387 1,645 2,439 3,725 3,135 4,104 4,909 8,921<br />
31.12.<strong>2006</strong> 4,540 747 1,268 1,513 2,088 3,337 2,679 3,553 3,983 5,441 7,338 36,487<br />
Ultimate loss for the individual accident years at the respective reporting dates (net)<br />
All figures in €m Accident year<br />
Date 1996 1997 1998 1999 2000 2001 2002 2003 2004 2005 <strong>2006</strong> Total<br />
31.12.1996 23,494<br />
31.12.1997 23,486 7,564<br />
31.12.1998 21,870 8,771 8,265<br />
31.12.1999 22,048 8,045 8,642 9,839<br />
31.12.2000 21,563 8,025 8,325 10,668 9,597<br />
31.12.2001 21,571 8,058 8,422 10,928 10,414 11,402<br />
31.12.2002 22,438 8,279 8,717 11,295 10,717 12,599 13,281<br />
31.12.2003 22,362 8,238 8,940 11,523 11,122 13,112 12,775 12,193<br />
31.12.2004 22,613 8,332 9,071 11,578 11,196 13,062 13,027 11,964 11,240<br />
31.12.2005 23,904 8,271 9,413 11,816 11,553 13,291 11,809 11,205 11,401 12,286<br />
31.12.<strong>2006</strong> 24,201 8,303 9,457 11,843 11,519 13,365 11,736 11,082 11,404 12,285 10,583 135,778<br />
Net run-off<br />
result –707 –739 –1,192 –2,004 –1,922 –1,963 1,545 1,111 –164 1 n/a –6,034<br />
Change<br />
2005 to <strong>2006</strong><br />
–297 –32 –44 –27 34 –74 73 123 –3 1 n/a –246<br />
The ultimate loss of an accident year comprises all payments made<br />
for that accident year up to the reporting date, plus the claims<br />
reserve at the reporting date. Given complete information regarding<br />
all losses incurred up to the balance sheet date, the ultimate loss<br />
status for each accident-year period would remain the same. In<br />
practice, however, it may be assumed that the ultimate loss status<br />
(based on estimates) is exposed to fluctuations that reflect the<br />
growth in knowledge about the claims cases.<br />
The run-off triangles are prepared on a currency-adjusted basis.<br />
To this end, all figures are translated from the respective local<br />
currency into the <strong>Group</strong> currency (euro), consistently using the<br />
exchange rates applicable at the end of the year under review (i.e. at<br />
31 December <strong>2006</strong>). This ensures that neutral net run-off results in<br />
the original currency (i.e. where the ultimate loss originally estimated<br />
for an accident year and current loss estimate are identical)<br />
remain neutral when expressed in the <strong>Group</strong> currency.<br />
185