Munich Re Group Annual Report 2006 (PDF, 1.8
Munich Re Group Annual Report 2006 (PDF, 1.8
Munich Re Group Annual Report 2006 (PDF, 1.8

You also want an ePaper? Increase the reach of your titles
YUMPU automatically turns print PDFs into web optimized ePapers that Google loves.
<strong>Munich</strong> <strong>Re</strong> <strong>Group</strong> <strong>Annual</strong> <strong>Re</strong>port <strong>2006</strong> Management report_<strong>Re</strong>insurance<br />
the significantly lower combined ratio of 92.6% (111.7%).<br />
Adjusted to eliminate the effects of major losses, the<br />
combined ratio of 86.4% (87.4%) again impressively underscores<br />
the improvement in the quality of our business over<br />
several years.<br />
Natural catastrophe losses affected our result with an<br />
amount of only €177m (2,629m), representing 1.3 (19.4) percentage<br />
points of our combined ratio. The only really significant<br />
loss in this category was Cyclone Larry, which in<br />
the first quarter of <strong>2006</strong> wreaked severe damage in Australia,<br />
costing us some €39m. Natural catastrophe losses<br />
of smaller dimensions were caused by heavy monsoon<br />
rains in India and Typhoon Shanshan in Japan. These loss<br />
events had an impact on the results of our Asia, Australasia,<br />
Africa Division.<br />
At €677m (664m), man-made losses were above the<br />
long-term average, with high loss amounts – together<br />
totalling some €128m – resulting from three industrial<br />
fires.<br />
Premium<br />
The renewal negotiations in <strong>2006</strong> showed the reinsurance<br />
markets to be stable. The enormous losses of the previous<br />
years – especially in lines exposed to natural hazards –<br />
have sharpened the risk awareness of market players and<br />
led to loss potentials being assessed more realistically. We<br />
were therefore largely able to realise our pricing expectations<br />
and treaty conditions and to stabilise the premium<br />
levels achieved in the previous years. As in the past, we<br />
systematically refrained from writing business that did not<br />
meet our requirements.<br />
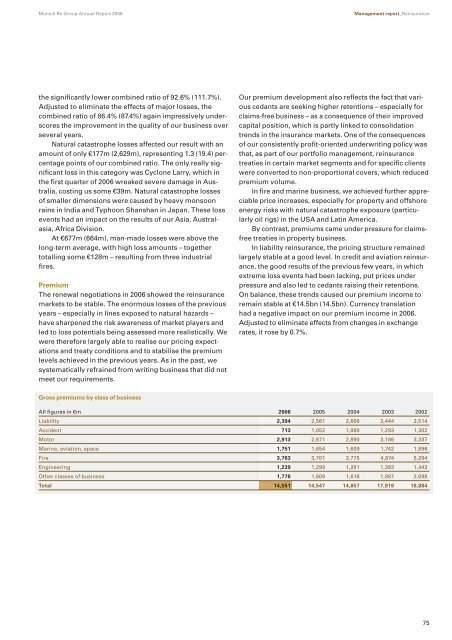
Gross premiums by class of business<br />
Our premium development also reflects the fact that various<br />
cedants are seeking higher retentions – especially for<br />
claims-free business – as a consequence of their improved<br />
capital position, which is partly linked to consolidation<br />
trends in the insurance markets. One of the consequences<br />
of our consistently profit-oriented underwriting policy was<br />
that, as part of our portfolio management, reinsurance<br />
treaties in certain market segments and for specific clients<br />
were converted to non-proportional covers, which reduced<br />
premium volume.<br />
In fire and marine business, we achieved further appreciable<br />
price increases, especially for property and offshore<br />
energy risks with natural catastrophe exposure (particularly<br />
oil rigs) in the USA and Latin America.<br />
By contrast, premiums came under pressure for claimsfree<br />
treaties in property business.<br />
In liability reinsurance, the pricing structure remained<br />
largely stable at a good level. In credit and aviation reinsurance,<br />
the good results of the previous few years, in which<br />
extreme loss events had been lacking, put prices under<br />
pressure and also led to cedants raising their retentions.<br />
On balance, these trends caused our premium income to<br />
remain stable at €14.5bn (14.5bn). Currency translation<br />
had a negative impact on our premium income in <strong>2006</strong>.<br />
Adjusted to eliminate effects from changes in exchange<br />
rates, it rose by 0.7%.<br />
All figures in €m <strong>2006</strong> 2005 2004 2003 2002<br />
Liability 2,394 2,561 2,606 3,444 3,514<br />
Accident 713 1,052 1,080 1,293 1,302<br />
Motor 2,913 2,671 2,890 3,186 3,337<br />
Marine, aviation, space 1,751 1,654 1,609 1,742 1,896<br />
Fire 3,763 3,701 3,775 4,874 5,294<br />
Engineering 1,239 1,299 1,281 1,393 1,443<br />
Other classes of business 1,778 1,609 1,616 1,987 2,098<br />
Total 14,551 14,547 14,857 17,919 18,884<br />
75