Environmental Statement - Maersk Oil
Environmental Statement - Maersk Oil
Environmental Statement - Maersk Oil

You also want an ePaper? Increase the reach of your titles
YUMPU automatically turns print PDFs into web optimized ePapers that Google loves.
5‐ 12<br />
Balloch Field Development <strong>Environmental</strong> <strong>Statement</strong><br />
Section 5 Assessment of Potential Impacts and Controls<br />
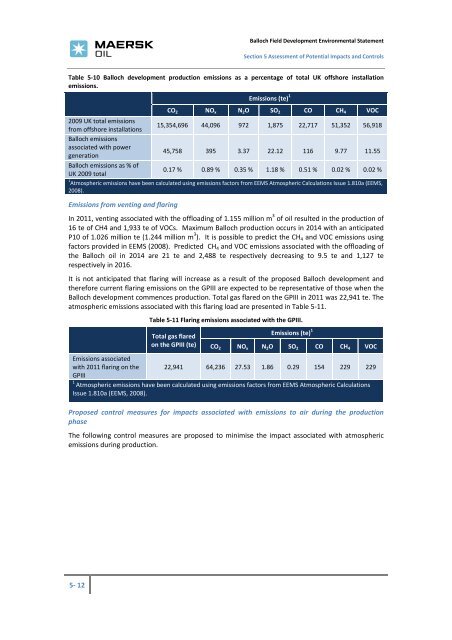
Table 5‐10 Balloch development production emissions as a percentage of total UK offshore installation<br />
emissions.<br />
Emissions (te) 1<br />
CO 2 NO x N 2O SO 2 CO CH 4 VOC<br />
2009 UK total emissions<br />
from offshore installations<br />
Balloch emissions<br />
15,354,696 44,096 972 1,875 22,717 51,352 56,918<br />
associated with power<br />
generation<br />
45,758 395 3.37 22.12 116 9.77 11.55<br />
Balloch emissions as % of<br />
UK 2009 total<br />
0.17 % 0.89 % 0.35 % 1.18 % 0.51 % 0.02 % 0.02 %<br />
1<br />
Atmospheric emissions have been calculated using emissions factors from EEMS Atmospheric Calculations Issue 1.810a (EEMS,<br />
2008).<br />
Emissions from venting and flaring<br />
In 2011, venting associated with the offloading of 1.155 million m 3 of oil resulted in the production of<br />
16 te of CH4 and 1,933 te of VOCs. Maximum Balloch production occurs in 2014 with an anticipated<br />
P10 of 1.026 million te (1.244 million m 3 ). It is possible to predict the CH4 and VOC emissions using<br />
factors provided in EEMS (2008). Predicted CH4 and VOC emissions associated with the offloading of<br />
the Balloch oil in 2014 are 21 te and 2,488 te respectively decreasing to 9.5 te and 1,127 te<br />
respectively in 2016.<br />
It is not anticipated that flaring will increase as a result of the proposed Balloch development and<br />
therefore current flaring emissions on the GPIII are expected to be representative of those when the<br />
Balloch development commences production. Total gas flared on the GPIII in 2011 was 22,941 te. The<br />
atmospheric emissions associated with this flaring load are presented in Table 5‐11.<br />
Table 5‐11 Flaring emissions associated with the GPIII.<br />
Total gas flared<br />
on the GPIII (te)<br />
Emissions (te) 1<br />
CO 2 NO x N 2O SO 2 CO CH 4 VOC<br />
Emissions associated<br />
with 2011 flaring on the<br />
GPIII<br />
22,941 64,236 27.53 1.86 0.29 154 229 229<br />
1<br />
Atmospheric emissions have been calculated using emissions factors from EEMS Atmospheric Calculations<br />
Issue 1.810a (EEMS, 2008).<br />
Proposed control measures for impacts associated with emissions to air during the production<br />
phase<br />
The following control measures are proposed to minimise the impact associated with atmospheric<br />
emissions during production.