Environmental Statement - Maersk Oil
Environmental Statement - Maersk Oil
Environmental Statement - Maersk Oil

Create successful ePaper yourself
Turn your PDF publications into a flip-book with our unique Google optimized e-Paper software.
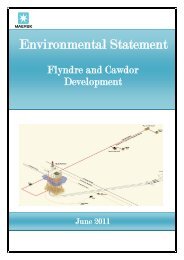
Balloch Field Development <strong>Environmental</strong> <strong>Statement</strong><br />
Section 3 Baseline Environment<br />
Total organic matter (TOM) ranged between 3.8 % (station 2) and 7.5 % (station 4) (Fugro, 2010).<br />
TOM levels at the majority of stations were higher than typical background levels found at 95 % of the<br />
stations in the CNS (4.48 %) (UKOOA, 2001).<br />
3.5.3. SEDIMENT CONTAMINANTS<br />
A summary of contaminant levels typically found in surface sediments of the North Sea is given in<br />
Table 3‐7. Across the North Sea, quantities of total hydrocarbons in sediments tend to show an<br />
increase from the SNS to the NNS, with background hydrocarbon concentrations being generally<br />
higher in fine sediments (muds and silts) than in coarser sediments (sands and gravels) due to their<br />
greater surface area and adsorptive capacity. Nevertheless, it should be noted that drilling activity<br />
and hence the input of oil derived contaminants has been considerably more intensive in the<br />
northern and central sectors compared to the SNS and consequently this would add to the higher<br />
levels recorded further north (CEFAS, 2001).<br />
For PAHs it is thought the same is true, with concentrations higher in the NNS relative to the SNS and<br />
total PAH concentration ranging between 0.02 µg/kg and 74.7 µg/kg at oil and gas locations.<br />
Table 3‐7 Contaminant levels typically found in surface sediments of the North Sea (Sheahan et al., 2001).<br />
Location<br />
<strong>Oil</strong> and Gas<br />
Installations<br />
THC<br />
(µg/g)<br />
10‐450<br />
PAH<br />
(µg/g)<br />
0.02‐<br />
74.7<br />
PCB<br />
(µg/kg)<br />
Nickel<br />
(µg/g)<br />
Copper<br />
(µg/g)<br />
Zinc<br />
(µg/g)<br />
Cadmium<br />
(µg/g)<br />
Mercury<br />
(µg/g)<br />
1,917 17.79 17.45 129.74 0.85 0.36<br />
Estuaries ‐ 0.2‐28 6.8‐19.1 ‐ ‐ ‐ ‐ ‐<br />
Coast ‐ ‐ 2 ‐ ‐ ‐ ‐ ‐<br />
Offshore 17‐120 0.2‐2.7 5000 m<br />
Nickel 17.79 15.36 9.18 9.5<br />
Copper 17.45 7.25 8.96 3.96<br />
Zinc 129.74 38.5 21.43 20.87<br />
Cadmium 0.85 5.56 0.2 0.43<br />
Mercury 0.36 0.22 0.33 0.16<br />
Lead 57.52 16.34 11.7 12.12<br />
Total Hydrocarbon Concentrations<br />
The stations surveyed by Fugro (2010) had relatively low levels of THCs. Levels varied from 2.8 µg/g<br />
dry weight to 6.6 µg/g at stations 4 and 6 respectively. These levels were higher than the<br />
concentrations recorded previously for the Donan field environmental survey (Fugro, 2005), but<br />
comparable to the published UKOOA (2001) mean background concentration of 9.51 µg/g.<br />
Carbon Preference Index (CPI)<br />
The Carbon Preference Index (CPI) is used to assess the relative contribution of petrogenic and<br />
biogenic sources in hydrocarbon samples and is determined by calculating the ratio of the sum of<br />
odd‐ to the sum of even‐carbon n‐alkanes. The range of n‐alkanes from nC21‐36 is of particular interest<br />
3 ‐ 15