Environmental Statement - Maersk Oil
Environmental Statement - Maersk Oil
Environmental Statement - Maersk Oil

Create successful ePaper yourself
Turn your PDF publications into a flip-book with our unique Google optimized e-Paper software.
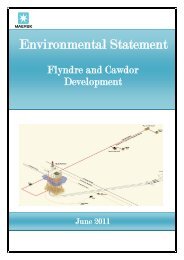
Balloch Field Development <strong>Environmental</strong> <strong>Statement</strong><br />
Section 3 Baseline Environment<br />
Table 3‐16 Total landings by the UK fishing fleet in ICES rectangle 45F0 (Scottish Government, 2012).<br />
Year<br />
Total landings (tonnes)<br />
UK total 45F0 45F0 as % of UK<br />
2009 617,797 3,152 0.5 %<br />
2010 632,933 4,018 0.6 %<br />
2011 622,571 1,931 0.3 %<br />
3.7.2. SHIPPING<br />
The development lies within the SEA 2 area. Shipping traffic within this area of the North Sea is<br />
relatively moderate, with an average of between 1 and 10 vessels per day passing through these<br />
waters. The majority of shipping traffic comprises of ships, supply vessels and tankers (Cordah, 2001).<br />
Merchant vessels account for over 61 % of vessels within the CNS, with 45 % of these vessels falling<br />
within the weight class of 0 ‐ 1499 deadweight tonnage (dwt). Supply vessel routes originate in<br />
Aberdeen or Peterhead. A number of tanker routes exist within the SEA 2 region, the majority of<br />
which are orientated along a north/south heading. All tankers within the area weigh in excess of<br />
40,000 dwt (Cordah, 2001). Table 3‐17 shows the shipping classifications for the CNS.<br />
Table 3‐17 Shipping classifications for the Central North Sea (Cordah, 2001).<br />
Shipping type Number of routes Total number of vessels Weight class (dwt)<br />
Merchant vessel 14 14,169 0‐1,499<br />
Supply vessels 20 8,564 0‐1,499<br />
Tankers 7 400 >40,000<br />
DECC use density to categorise shipping activities in the North Sea, ranking each block as having very<br />
low, low, moderate, high or very high shipping densities. Block 15/20 is classed as having a moderate<br />
level of shipping activity (DECC, 2012).<br />
The shipping routes in the vicinity of the proposed Balloch development were identified using<br />
Anatec’s ‘ShipRoutes’ software (Anatec, 2008). This data is continuously updated and takes into<br />
account changes to shipping routes necessitated by new and existing oil and gas installations. The<br />
database, however, does not include non‐fixed routes, i.e. movements of fishing vessels and traffic to<br />
mobile drilling units.<br />
The number of movements per year on routes passing through UK waters was estimated by analysing<br />
ship callings data at ports in the UK and Western Europe (ships greater than 100 tonnes). This<br />
included full details on the vessel characteristics, including type and size. Supplementary information<br />
was also obtained directly from ship operators, such as for passenger ferry and offshore support<br />
vessels.<br />
The routes taken by ships between ports were obtained from several data sources, including:<br />
Offshore installation, standby vessel and shore‐based survey data;<br />
Passage plans obtained from ship operators;<br />
Consultation with ports and pilots;<br />
Admiralty charts and publications.<br />
Overall, 22 routes passing within 10 nm of Balloch were identified (Figure 3‐18). These routes are<br />
trafficked by an estimated 1,990 vessels per annum, which corresponds to an average of 5 vessels per<br />
day. 52 % of the traffic is made up of cargo vessels (Figure 3‐19), 60 % of which have a dwt between<br />
1500 ‐ 5000 te.<br />
3 ‐ 31