Tracing the Source of the Elephant And Hippopotamus Ivory from ...
Tracing the Source of the Elephant And Hippopotamus Ivory from ...
Tracing the Source of the Elephant And Hippopotamus Ivory from ...

You also want an ePaper? Increase the reach of your titles
YUMPU automatically turns print PDFs into web optimized ePapers that Google loves.
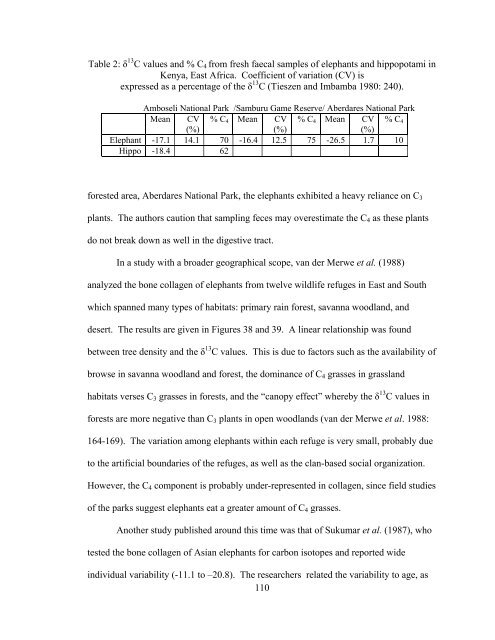
Table 2: δ 13 C values and % C4 <strong>from</strong> fresh faecal samples <strong>of</strong> elephants and hippopotami in<br />
Kenya, East Africa. Coefficient <strong>of</strong> variation (CV) is<br />
expressed as a percentage <strong>of</strong> <strong>the</strong> δ 13 C (Tieszen and Imbamba 1980: 240).<br />
Amboseli National Park /Samburu Game Reserve/ Aberdares National Park<br />
Mean CV % C4 Mean CV % C4 Mean CV % C4<br />
(%)<br />
(%)<br />
(%)<br />
<strong>Elephant</strong> -17.1 14.1 70 -16.4 12.5 75 -26.5 1.7 10<br />
Hippo -18.4 62<br />
forested area, Aberdares National Park, <strong>the</strong> elephants exhibited a heavy reliance on C3<br />
plants. The authors caution that sampling feces may overestimate <strong>the</strong> C4 as <strong>the</strong>se plants<br />
do not break down as well in <strong>the</strong> digestive tract.<br />
In a study with a broader geographical scope, van der Merwe et al. (1988)<br />
analyzed <strong>the</strong> bone collagen <strong>of</strong> elephants <strong>from</strong> twelve wildlife refuges in East and South<br />
which spanned many types <strong>of</strong> habitats: primary rain forest, savanna woodland, and<br />
desert. The results are given in Figures 38 and 39. A linear relationship was found<br />
between tree density and <strong>the</strong> δ 13 C values. This is due to factors such as <strong>the</strong> availability <strong>of</strong><br />
browse in savanna woodland and forest, <strong>the</strong> dominance <strong>of</strong> C4 grasses in grassland<br />
habitats verses C3 grasses in forests, and <strong>the</strong> “canopy effect” whereby <strong>the</strong> δ 13 C values in<br />
forests are more negative than C3 plants in open woodlands (van der Merwe et al. 1988:<br />
164-169). The variation among elephants within each refuge is very small, probably due<br />
to <strong>the</strong> artificial boundaries <strong>of</strong> <strong>the</strong> refuges, as well as <strong>the</strong> clan-based social organization.<br />
However, <strong>the</strong> C4 component is probably under-represented in collagen, since field studies<br />
<strong>of</strong> <strong>the</strong> parks suggest elephants eat a greater amount <strong>of</strong> C4 grasses.<br />
Ano<strong>the</strong>r study published around this time was that <strong>of</strong> Sukumar et al. (1987), who<br />
tested <strong>the</strong> bone collagen <strong>of</strong> Asian elephants for carbon isotopes and reported wide<br />
individual variability (-11.1 to –20.8). The researchers related <strong>the</strong> variability to age, as<br />
110