Chapter 1 - Caltrans - State of California
Chapter 1 - Caltrans - State of California
Chapter 1 - Caltrans - State of California

You also want an ePaper? Increase the reach of your titles
YUMPU automatically turns print PDFs into web optimized ePapers that Google loves.
<strong>Chapter</strong> 2 Affected Environment, Environmental Consequences, and Mitigation Measures<br />
Between 1990 and 2000, the study area showed an approximately 8.7 percent increase in<br />
the total minority population which was similar to both Santa Barbara and Ventura<br />
Counties, which showed increases <strong>of</strong> 9.3 percent and 9.4 percent respectively. This data<br />
indicates the region is becoming increasingly racially and ethnically diverse.<br />
Age<br />
As <strong>of</strong> 2000, most <strong>of</strong> the total population within the study area (15,341 persons),<br />
approximately 62.5 percent (9,585 persons) were <strong>of</strong> working age, defined as between 18<br />
and 64 years <strong>of</strong> age. Additionally, approximately 25.2 percent were under 18 years and<br />
approximately 12.3 percent were 65 years and over within the study area as well as Santa<br />
Barbara and Ventura Counties which has remained relatively constant.<br />
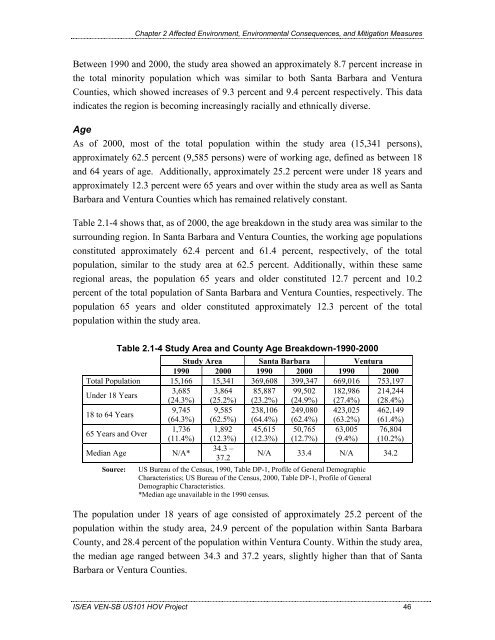
Table 2.1-4 shows that, as <strong>of</strong> 2000, the age breakdown in the study area was similar to the<br />
surrounding region. In Santa Barbara and Ventura Counties, the working age populations<br />
constituted approximately 62.4 percent and 61.4 percent, respectively, <strong>of</strong> the total<br />
population, similar to the study area at 62.5 percent. Additionally, within these same<br />
regional areas, the population 65 years and older constituted 12.7 percent and 10.2<br />
percent <strong>of</strong> the total population <strong>of</strong> Santa Barbara and Ventura Counties, respectively. The<br />
population 65 years and older constituted approximately 12.3 percent <strong>of</strong> the total<br />
population within the study area.<br />
Table 2.1-4 Study Area and County Age Breakdown-1990-2000<br />
Study Area Santa Barbara Ventura<br />
1990 2000 1990 2000 1990 2000<br />
Total Population 15,166 15,341 369,608 399,347 669,016 753,197<br />
Under 18 Years<br />
3,685<br />
(24.3%)<br />
3,864<br />
(25.2%)<br />
85,887<br />
(23.2%)<br />
99,502<br />
(24.9%)<br />
182,986<br />
(27.4%)<br />
214,244<br />
(28.4%)<br />
18 to 64 Years<br />
9,745 9,585 238,106 249,080 423,025 462,149<br />
65 Years and Over<br />
(64.3%)<br />
1,736<br />
(11.4%)<br />
Median Age N/A*<br />
(62.5%)<br />
1,892<br />
(12.3%)<br />
34.3 –<br />
37.2<br />
(64.4%)<br />
45,615<br />
(12.3%)<br />
(62.4%)<br />
50,765<br />
(12.7%)<br />
(63.2%)<br />
63,005<br />
(9.4%)<br />
(61.4%)<br />
76,804<br />
(10.2%)<br />
N/A 33.4 N/A 34.2<br />
Source: US Bureau <strong>of</strong> the Census, 1990, Table DP-1, Pr<strong>of</strong>ile <strong>of</strong> General Demographic<br />
Characteristics; US Bureau <strong>of</strong> the Census, 2000, Table DP-1, Pr<strong>of</strong>ile <strong>of</strong> General<br />
Demographic Characteristics.<br />
*Median age unavailable in the 1990 census.<br />
The population under 18 years <strong>of</strong> age consisted <strong>of</strong> approximately 25.2 percent <strong>of</strong> the<br />
population within the study area, 24.9 percent <strong>of</strong> the population within Santa Barbara<br />
County, and 28.4 percent <strong>of</strong> the population within Ventura County. Within the study area,<br />
the median age ranged between 34.3 and 37.2 years, slightly higher than that <strong>of</strong> Santa<br />
Barbara or Ventura Counties.<br />
IS/EA VEN-SB US101 HOV Project 46