Chapter 1 - Caltrans - State of California
Chapter 1 - Caltrans - State of California
Chapter 1 - Caltrans - State of California
Create successful ePaper yourself
Turn your PDF publications into a flip-book with our unique Google optimized e-Paper software.
<strong>Chapter</strong> 3 Comments and Coordination<br />
Bailard Avenue, northbound U.S. 101 generally operates at LOS C during the AM peak.<br />
During the PM peak, southbound U.S. 101 operates at LOS C between Bailard Avenue at<br />
Bates Road, and at LOS D between Bates Road and Seacliff exit.<br />
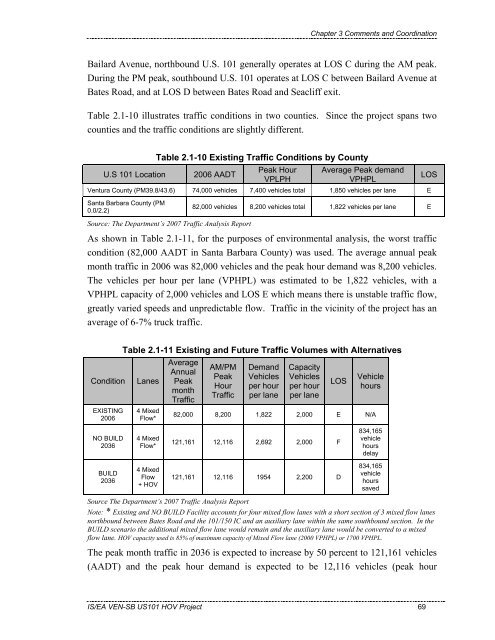
Table 2.1-10 illustrates traffic conditions in two counties. Since the project spans two<br />
counties and the traffic conditions are slightly different.<br />
Table 2.1-10 Existing Traffic Conditions by County<br />
U.S 101 Location 2006 AADT<br />
Peak Hour<br />
VPLPH<br />
Average Peak demand<br />
VPHPL<br />
Ventura County (PM39.8/43.6) 74,000 vehicles 7,400 vehicles total 1,850 vehicles per lane E<br />
Santa Barbara County (PM<br />
0.0/2.2)<br />
Source: The Department’s 2007 Traffic Analysis Report<br />
82,000 vehicles 8,200 vehicles total 1,822 vehicles per lane E<br />
As shown in Table 2.1-11, for the purposes <strong>of</strong> environmental analysis, the worst traffic<br />
condition (82,000 AADT in Santa Barbara County) was used. The average annual peak<br />
month traffic in 2006 was 82,000 vehicles and the peak hour demand was 8,200 vehicles.<br />
The vehicles per hour per lane (VPHPL) was estimated to be 1,822 vehicles, with a<br />
VPHPL capacity <strong>of</strong> 2,000 vehicles and LOS E which means there is unstable traffic flow,<br />
greatly varied speeds and unpredictable flow. Traffic in the vicinity <strong>of</strong> the project has an<br />
average <strong>of</strong> 6-7% truck traffic.<br />
Table 2.1-11 Existing and Future Traffic Volumes with Alternatives<br />
Condition Lanes<br />
EXISTING<br />
2006<br />
NO BUILD<br />
2036<br />
BUILD<br />
2036<br />
4 Mixed<br />
Flow*<br />
4 Mixed<br />
Flow*<br />
4 Mixed<br />
Flow<br />
+ HOV<br />
Average<br />
Annual<br />
Peak<br />
month<br />
Traffic<br />
AM/PM<br />
Peak<br />
Hour<br />
Traffic<br />
Source The Department’s 2007 Traffic Analysis Report<br />
Demand<br />
Vehicles<br />
per hour<br />
per lane<br />
Capacity<br />
Vehicles<br />
per hour<br />
per lane<br />
LOS Vehicle<br />
hours<br />
82,000 8,200 1,822 2,000 E N/A<br />
121,161 12,116 2,692 2,000 F<br />
121,161 12,116 1954 2,200 D<br />
834,165<br />
vehicle<br />
hours<br />
delay<br />
834,165<br />
vehicle<br />
hours<br />
saved<br />
Note: * Existing and NO BUILD Facility accounts for four mixed flow lanes with a short section <strong>of</strong> 3 mixed flow lanes<br />
northbound between Bates Road and the 101/150 IC and an auxiliary lane within the same southbound section. In the<br />
BUILD scenario the additional mixed flow lane would remain and the auxiliary lane would be converted to a mixed<br />
flow lane. HOV capacity used is 85% <strong>of</strong> maximum capacity <strong>of</strong> Mixed Flow lane (2000 VPHPL) or 1700 VPHPL.<br />
The peak month traffic in 2036 is expected to increase by 50 percent to 121,161 vehicles<br />
(AADT) and the peak hour demand is expected to be 12,116 vehicles (peak hour<br />
IS/EA VEN-SB US101 HOV Project 69<br />
LOS


