- Page 1 and 2:
VENTURA / SANTA BARBARA 101 HOV PRO
- Page 4 and 5:
VEN-SB US101 HOV Project IS/EA ❖
- Page 6 and 7:
❖ iv VEN-SB US101 HOV Project IS/
- Page 9 and 10:
List of Figures List of Figures Fig
- Page 11 and 12:
Chapter 1Proposed Project 1.1 Intro
- Page 13 and 14:
Chapter 1 Proposed Project Backgrou
- Page 15 and 16:
Chapter 1 Proposed Project between
- Page 17 and 18:
Chapter 1 Proposed Project on a bas
- Page 19 and 20:
Chapter 1 Proposed Project For Vent
- Page 21 and 22: Chapter 1 Proposed Project South Co
- Page 23 and 24: Chapter 1 Proposed Project • Inst
- Page 25 and 26: Source: The Department 2008 Chapter
- Page 27 and 28: Chapter 1 Proposed Project 1.2.7 Pe
- Page 29 and 30: Chapter 2 Affected Environment, Env
- Page 31 and 32: Chapter 2 Affected Environment, Env
- Page 33 and 34: IS/EA VEN-SB US101 HOV Project 23 C
- Page 35 and 36: IS/EA VEN-SB US101 HOV Project 25 C
- Page 37 and 38: Chapter 2 Affected Environment, Env
- Page 39 and 40: Chapter 2 Affected Environment, Env
- Page 41 and 42: Chapter 2 Affected Environment, Env
- Page 43 and 44: Chapter 2 Affected Environment, Env
- Page 45 and 46: Chapter 2 Affected Environment, Env
- Page 47 and 48: Chapter 2 Affected Environment, Env
- Page 49 and 50: Chapter 2 Affected Environment, Env
- Page 51 and 52: 2.1.6 Farmlands Chapter 2 Affected
- Page 53 and 54: Chapter 2 Affected Environment, Env
- Page 55 and 56: Total Population Race White Black o
- Page 57 and 58: Chapter 2 Affected Environment, Env
- Page 59 and 60: Chapter 2 Affected Environment, Env
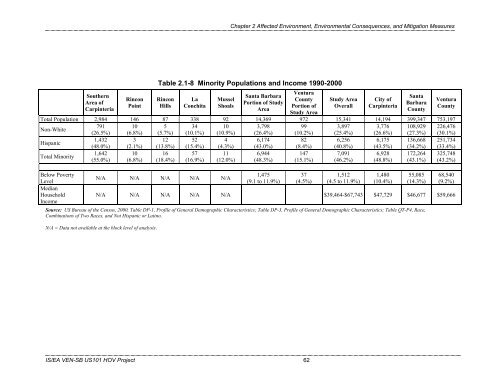
- Page 61 and 62: Housing Units Owner Occupied Renter
- Page 63 and 64: Chapter 2 Affected Environment, Env
- Page 65 and 66: Chapter 2 Affected Environment, Env
- Page 67 and 68: Chapter 2 Affected Environment, Env
- Page 69 and 70: Chapter 2 Affected Environment, Env
- Page 71: Chapter 2 Affected Environment, Env
- Page 75 and 76: Chapter 3 Comments and Coordination
- Page 77 and 78: Chapter 3 Comments and Coordination
- Page 79 and 80: Chapter 3 Comments and Coordination
- Page 81 and 82: Chapter 3 Comments and Coordination
- Page 83 and 84: Chapter 3 Comments and Coordination
- Page 85 and 86: Chapter 3 Comments and Coordination
- Page 87 and 88: Chapter 3 Comments and Coordination
- Page 89 and 90: Chapter 3 Comments and Coordination
- Page 91 and 92: Chapter 3 Comments and Coordination
- Page 93 and 94: Chapter 3 Comments and Coordination
- Page 95 and 96: Chapter 3 Comments and Coordination
- Page 97 and 98: Chapter 3 Comments and Coordination
- Page 99 and 100: Chapter 3 Comments and Coordination
- Page 101 and 102: Chapter 3 Comments and Coordination
- Page 103 and 104: Chapter 3 Comments and Coordination
- Page 105 and 106: Bikeway Chapter 3 Comments and Coor
- Page 107 and 108: Chapter 3 Comments and Coordination
- Page 109 and 110: Chapter 3 Comments and Coordination
- Page 111 and 112: Chapter 3 Comments and Coordination
- Page 113 and 114: Chapter 3 Comments and Coordination
- Page 115 and 116: Chapter 3 Comments and Coordination
- Page 117 and 118: Chapter 3 Comments and Coordination
- Page 119 and 120: Chapter 3 Comments and Coordination
- Page 121 and 122: Chapter 3 Comments and Coordination
- Page 123 and 124:
Chapter 3 Comments and Coordination
- Page 125 and 126:
Chapter 3 Comments and Coordination
- Page 127 and 128:
Chapter 3 Comments and Coordination
- Page 129 and 130:
Chapter 3 Comments and Coordination
- Page 131 and 132:
• Provide hardscape decorative de
- Page 133 and 134:
Chapter 3 Comments and Coordination
- Page 135 and 136:
Chapter 3 Comments and Coordination
- Page 137 and 138:
To comply, the following must be an
- Page 139 and 140:
Chapter 3 Comments and Coordination
- Page 141 and 142:
• Soil stabilization Practices
- Page 143 and 144:
Chapter 3 Comments and Coordination
- Page 145 and 146:
Chapter 3 Comments and Coordination
- Page 147 and 148:
Chapter 3 Comments and Coordination
- Page 149 and 150:
2.2.6 Air Quality Chapter 3 Comment
- Page 151 and 152:
Chapter 3 Comments and Coordination
- Page 153 and 154:
Chapter 3 Comments and Coordination
- Page 155 and 156:
Chapter 3 Comments and Coordination
- Page 157 and 158:
Chapter 3 Comments and Coordination
- Page 159 and 160:
Chapter 3 Comments and Coordination
- Page 161 and 162:
Chapter 3 Comments and Coordination
- Page 163 and 164:
Chapter 3 Comments and Coordination
- Page 165 and 166:
Chapter 3 Comments and Coordination
- Page 167 and 168:
Chapter 3 Comments and Coordination
- Page 169 and 170:
Chapter 3 Comments and Coordination
- Page 171 and 172:
Chapter 3 Comments and Coordination
- Page 173 and 174:
Chapter 3 Comments and Coordination
- Page 175 and 176:
Chapter 3 Comments and Coordination
- Page 177 and 178:
Chapter 3 Comments and Coordination
- Page 179 and 180:
Receiver Site #A Site #A1 Site #A2
- Page 181 and 182:
Chapter 3 Comments and Coordination
- Page 183 and 184:
Chapter 3 Comments and Coordination
- Page 185 and 186:
Chapter 3 Comments and Coordination
- Page 187 and 188:
Chapter 3 Comments and Coordination
- Page 189 and 190:
Chapter 3 Comments and Coordination
- Page 191 and 192:
Chapter 3 Comments and Coordination
- Page 193 and 194:
Chapter 3 Comments and Coordination
- Page 195 and 196:
Chapter 3 Comments and Coordination
- Page 197 and 198:
Table 2.4-1 Cumulative Projects and
- Page 199 and 200:
Chapter 3 Comments and Coordination
- Page 201 and 202:
Chapter 3 Comments and Coordination
- Page 203 and 204:
Chapter 3 Comments and Coordination
- Page 205 and 206:
Chapter 3 Comments and Coordination
- Page 207 and 208:
Chapter 3 Comments and Coordination
- Page 209 and 210:
Chapter 3 Comments and Coordination
- Page 211 and 212:
Chapter 3 Comments and Coordination
- Page 213 and 214:
Chapter 4 List of Preparers Chapter
- Page 215 and 216:
Chapter 5 Distribution List Elected
- Page 217 and 218:
California Native Plant Society 909
- Page 219 and 220:
Community Based Organizations Ventu
- Page 221 and 222:
Richard Zavala Rincon Island/ Greka
- Page 223 and 224:
Evan E Skei Resident 6770 Ojai Ave.
- Page 225 and 226:
Mary C & James Cox Resident 7062 Ox
- Page 227 and 228:
Virginia Cotsis Resident 6820 Santa
- Page 229 and 230:
Doug and Jaleh White 8128 Puesta De
- Page 231 and 232:
Harry Van Wingerden 3902 Via Real C
- Page 233 and 234:
Thomas J. McGillis, M.D. 5206 Beckf
- Page 235 and 236:
Appendix A CEQA Checklist Appendix
- Page 237 and 238:
) Violate any air quality standard
- Page 239 and 240:
Potentially significant impact Less
- Page 241 and 242:
Potentially significant impact Less
- Page 243 and 244:
Please refer to section e) 12. POPU
- Page 245 and 246:
Potentially significant impact Less
- Page 247 and 248:
Appendix B Traffic Flow Charts Exis
- Page 249 and 250:
2015 Build Appendix B Traffic Flow
- Page 251 and 252:
2035 Build Appendix B Traffic Flow
- Page 253 and 254:
Appendix C Title VI Policy Statemen
- Page 255 and 256:
Appendix D Glossary and Abbreviated
- Page 257 and 258:
Appendix E Minimization and/or Miti
- Page 259 and 260:
Impact Avoidance or Minimization Me
- Page 261 and 262:
Impact Avoidance or Minimization Me
- Page 263 and 264:
Impact Avoidance or Minimization Me
- Page 265 and 266:
Impact Avoidance or Minimization Me
- Page 267 and 268:
Impact Avoidance or Minimization Me
- Page 269 and 270:
Appendix F Noise Aerial Maps and Ta
- Page 271 and 272:
20-Minute Noise Measurement Locatio
- Page 273 and 274:
20-Minute Noise Measurement Locatio
- Page 275 and 276:
IS/EA VEN-SB US101 HOV Project 265
- Page 277 and 278:
20-Minute Noise Measurement Locatio
- Page 279 and 280:
20-Minute Noise Measurement Locatio
- Page 281 and 282:
Table B Predicted Noise Reduction F
- Page 283 and 284:
Appendix G Letter to the State Hist
- Page 285:
IS/EA VEN-SB US101 HOV Project 275