

State of the Bay Report 2010-Final - Anchor Environmental
State of the Bay Report 2010-Final - Anchor Environmental
State of the Bay Report 2010-Final - Anchor Environmental

You also want an ePaper? Increase the reach of your titles
YUMPU automatically turns print PDFs into web optimized ePapers that Google loves.
and percentage organic nitrogen (PON) between 2008 and 2009 in Big <strong>Bay</strong>, and <strong>the</strong> concentrations<br />
<strong>of</strong> mud and heavy metals were very low within Big <strong>Bay</strong>. These results toge<strong>the</strong>r with <strong>the</strong> lack <strong>of</strong><br />
obvious anthropogenic discharges into Big <strong>Bay</strong> suggest that <strong>the</strong> changes in species composition<br />
within <strong>the</strong> <strong>Bay</strong> are most likely a result <strong>of</strong> natural perturbations. The sites at which <strong>the</strong> numbers <strong>of</strong><br />
polychaetes increased <strong>the</strong> most were also <strong>the</strong> sites where <strong>the</strong> sensitive sea-pen were found. It is<br />
thus unlikely that <strong>the</strong> sudden appearance <strong>of</strong> polychaetes is due to an increase in pollution. The<br />
average W statistic calculated for Big <strong>Bay</strong> in <strong>2010</strong> was higher than that <strong>of</strong> 2009. This may be due to<br />
<strong>the</strong> reduction in <strong>the</strong> densities <strong>of</strong> polychaetes which suggests that pollution levels had reduced<br />
between 2009 and <strong>2010</strong>. However, this does not correlate with physical data recorded in Big <strong>Bay</strong>,<br />
which suggests that <strong>the</strong>se fluctuations may be a consequence <strong>of</strong> natural perturbations and<br />
community interactions.<br />
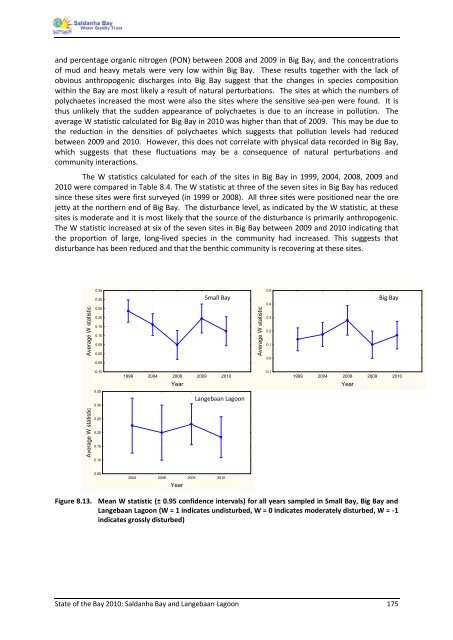
The W statistics calculated for each <strong>of</strong> <strong>the</strong> sites in Big <strong>Bay</strong> in 1999, 2004, 2008, 2009 and<br />
<strong>2010</strong> were compared in Table 8.4. The W statistic at three <strong>of</strong> <strong>the</strong> seven sites in Big <strong>Bay</strong> has reduced<br />
since <strong>the</strong>se sites were first surveyed (in 1999 or 2008). All three sites were positioned near <strong>the</strong> ore<br />
jetty at <strong>the</strong> nor<strong>the</strong>rn end <strong>of</strong> Big <strong>Bay</strong>. The disturbance level, as indicated by <strong>the</strong> W statistic, at <strong>the</strong>se<br />
sites is moderate and it is most likely that <strong>the</strong> source <strong>of</strong> <strong>the</strong> disturbance is primarily anthropogenic.<br />
The W statistic increased at six <strong>of</strong> <strong>the</strong> seven sites in Big <strong>Bay</strong> between 2009 and <strong>2010</strong> indicating that<br />
<strong>the</strong> proportion <strong>of</strong> large, long-lived species in <strong>the</strong> community had increased. This suggests that<br />
disturbance has been reduced and that <strong>the</strong> benthic community is recovering at <strong>the</strong>se sites.<br />
Average W statistic<br />
Average W statistic<br />
0.35<br />
0.30<br />
0.25<br />
0.20<br />
0.15<br />
0.10<br />
0.05<br />
0.00<br />
-0.05<br />
-0.10<br />
0.35<br />
0.30<br />
0.25<br />
0.20<br />
0.15<br />
0.10<br />
0.05<br />
Year; LS Means<br />
Current effect: F(4, 53)=3.8349, p=.00825<br />
Effective hypo<strong>the</strong>sis decomposition<br />
Vertical bars denote 0.95 confidence intervals<br />
Include condition: V3="SB"$<br />
1999<br />
Year; LS Means<br />
Current effect: F(3, 24)=.33708, p=.79866<br />
Effective 2004hypo<strong>the</strong>sis 2008 decomposition 2009 <strong>2010</strong><br />
Vertical bars denote 0.95 confidence intervals<br />
Include condition: Year V3="LL"$<br />
2004 2008 2009 <strong>2010</strong><br />
Year<br />
Small <strong>Bay</strong><br />
Langebaan Lagoon<br />
Year; LS Means<br />
Current effect: F(4, 34)=1.6740, p=.17873<br />
Effective hypo<strong>the</strong>sis decomposition<br />
Vertical bars denote 0.95 confidence intervals<br />
Include condition: V3="BB"$<br />
1999 2004 2008 2009 <strong>2010</strong><br />
<strong>State</strong> <strong>of</strong> <strong>the</strong> <strong>Bay</strong> <strong>2010</strong>: Saldanha <strong>Bay</strong> and Langebaan Lagoon 175<br />
Average W statistic<br />
0.5<br />
0.4<br />
0.3<br />
0.2<br />
0.1<br />
0.0<br />
-0.1<br />
Year<br />
Big <strong>Bay</strong><br />
Figure 8.13. Mean W statistic (± 0.95 confidence intervals) for all years sampled in Small <strong>Bay</strong>, Big <strong>Bay</strong> and<br />
Langebaan Lagoon (W = 1 indicates undisturbed, W = 0 indicates moderately disturbed, W = -1<br />
indicates grossly disturbed)


