- Page 1:
State of the Bay 2010: Saldanha Bay
- Page 5 and 6:
TABLE OF CONTENTS Anchor Environmen
- Page 7 and 8:
11 BIRDS 234 Anchor Environmental 1
- Page 9 and 10:
LIST OF FIGURES Anchor Environmenta
- Page 11 and 12:
Anchor Environmental Figure 4.27. O
- Page 13 and 14:
Anchor Environmental Figure 7.3. Ch
- Page 15 and 16:
Anchor Environmental Figure 9.10. C
- Page 17 and 18:
Anchor Environmental Figure 12.1. N
- Page 19 and 20:
Anchor Environmental samples were c
- Page 21 and 22:
EXECUTIVE SUMMARY Anchor Environmen
- Page 23 and 24:
Anchor Environmental matter in the
- Page 25 and 26:
Anchor Environmental considered mos
- Page 27 and 28:
Anchor Environmental again in 2004,
- Page 29 and 30:
Anchor Environmental Populations of
- Page 31 and 32:
GLOSSARY Alien species An introduce
- Page 33 and 34:
1 INTRODUCTION Anchor Environmental
- Page 35 and 36:
2 STRUCTURE OF THIS REPORT Anchor E
- Page 37 and 38:
Anchor Environmental complicates ma
- Page 39 and 40: Anchor Environmental observed deter
- Page 41 and 42: Anchor Environmental 4 ACTIVITIES A
- Page 43 and 44: Fish factories Small craft harbour
- Page 45 and 46: Anchor Environmental Aerial photogr
- Page 47 and 48: Anchor Environmental interferes wit
- Page 49 and 50: Anchor Environmental Figure 4.7. Nu
- Page 51 and 52: o Decrease in oxygen concentrations
- Page 53 and 54: Anchor Environmental Upgrades to th
- Page 55 and 56: Anchor Environmental Figure 4.9. A)
- Page 57 and 58: Anchor Environmental (possibly link
- Page 59 and 60: Anchor Environmental Prestedge Reti
- Page 61 and 62: Anchor Environmental the constructi
- Page 63 and 64: Number and types of vessels enterin
- Page 65 and 66: Anchor Environmental is contained b
- Page 67 and 68: Anchor Environmental include the be
- Page 69 and 70: o 33 3’S o 33 10’S Saldanha Bay
- Page 71 and 72: Anchor Environmental (1956) UNDER T
- Page 73 and 74: Free ACtive Chlorine (mg/l) Amonia
- Page 75 and 76: Faecal coliforms (org/100 ml) Chemi
- Page 77 and 78: 4.3.7 Storm water Anchor Environmen
- Page 79 and 80: Anchor Environmental sites (concent
- Page 81 and 82: Anchor Environmental Discharges fro
- Page 83 and 84: Anchor Environmental Table 4.9. Det
- Page 85 and 86: 5 WATER QUALITY Anchor Environmenta
- Page 87 and 88: Anchor Environmental Stander (1977)
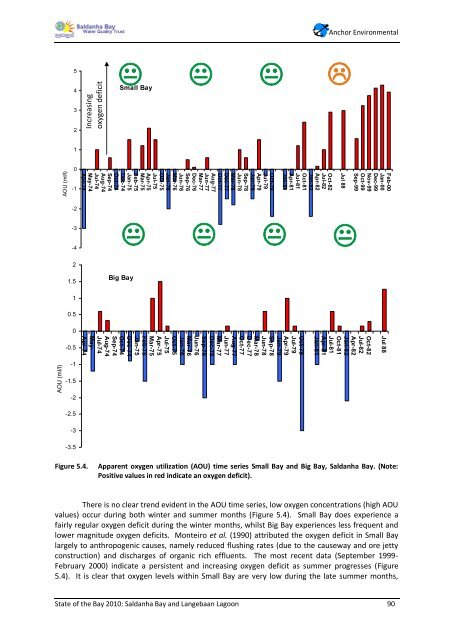
- Page 89: Anchor Environmental coast, result
- Page 93 and 94: Anchor Environmental Construction o
- Page 95 and 96: Anchor Environmental Table 5.2. Per
- Page 97 and 98: Anchor Environmental Table 5.4. Per
- Page 99 and 100: Anchor Environmental Table 5.6. Per
- Page 101 and 102: Anchor Environmental Table 5.8. Per
- Page 103 and 104: Counts per 100ml of sample Counts p
- Page 105 and 106: Counts per 100ml of sample 10000 10
- Page 107 and 108: 5.6 Trace Metal Contaminants in the
- Page 109 and 110: State of the Bay 2010: Saldanha Bay
- Page 111 and 112: Lead(mg/kg) Mercury (mg/kg) Cadmium
- Page 113 and 114: 6 SEDIMENTS 6.1 Sediment particle s
- Page 115 and 116: 6.1.2 Sediment Particle size result
- Page 117 and 118: State of the Bay 2010: Saldanha Bay
- Page 119 and 120: 100% 90% 80% 70% 60% 50% 40% 30% 20
- Page 121 and 122: State of the Bay 2010: Saldanha Bay
- Page 123 and 124: State of the Bay 2010: Saldanha Bay
- Page 125 and 126: % POC 18 16 14 12 10 8 6 4 2 0 % PO
- Page 127 and 128: Percentage Percentage 1.8 1.6 1.4 1
- Page 129 and 130: o 33 3’S o 33 10’S Yacht Club B
- Page 131 and 132: Figure 6.12. Variation in the conce
- Page 133 and 134: The concentrations of metals in sed
- Page 135 and 136: concentrations are 56 and 29 times
- Page 137 and 138: threshold of 1.2 mg/kg established
- Page 139 and 140: Cadmium (mg/kg) 8 7 6 5 4 3 2 1 0 C
- Page 141 and 142:
Copper (mg/kg) 45 40 35 30 25 20 15
- Page 143 and 144:
16000 14000 12000 10000 8000 6000 4
- Page 145 and 146:
In summary, elevated trace metal co
- Page 147 and 148:
6.5 Summary of sediment health stat
- Page 149 and 150:
7.1 Long term changes in seagrass i
- Page 151 and 152:
7.2 Long term changes in Saltmarshe
- Page 153 and 154:
Figure 8.1. Benthic macrofauna samp
- Page 155 and 156:
Table 8.1. Depth at each of the sit
- Page 157 and 158:
these species usually provide the l
- Page 159 and 160:
(clustering of similar groups) (Meg
- Page 161 and 162:
The Big Bay samples BB 25 and BB29
- Page 163 and 164:
2007/08 dredging. Other signs of th
- Page 165 and 166:
Wet mass per m² Wet mass per m² 4
- Page 167 and 168:
Big Bay Crustaceans and polychaetes
- Page 169 and 170:
Average number of individuals per m
- Page 171 and 172:
Number Individuals per m² Number I
- Page 173 and 174:
8.4.2 Abundance Biomass Indices 8.4
- Page 175 and 176:
and percentage organic nitrogen (PO
- Page 177 and 178:
Table 8.5. W statistics at all stat
- Page 179 and 180:
Figure 8.15: Variation in the diver
- Page 181 and 182:
percentage of mud compared to Lange
- Page 183 and 184:
Cu (mg/kg) Cd (mg/kg) Ni (mg/kg) Pb
- Page 185 and 186:
contaminants. Furthermore dredging
- Page 187 and 188:
areas even 5 months after the clear
- Page 189 and 190:
Brittle star ( Ophiuroidea spp) Sea
- Page 191 and 192:
9.2 Approach and Methodology 9.2.1
- Page 193 and 194:
cover data for both mobile and sess
- Page 195 and 196:
9.2.3 Data Analysis The similaritie
- Page 197 and 198:
40%, co-occurring with sponges espe
- Page 199 and 200:
stands of the kelp Ecklonia maxima
- Page 201 and 202:
Plocamium spp. Ecklonia maxima Scut
- Page 203 and 204:
20 40 A Group 1 B 60 Similarity C G
- Page 205 and 206:
Percentage Cover 80 70 60 50 40 30
- Page 207 and 208:
Evenness Shannon Wiener 0.9 0.8 0.7
- Page 209 and 210:
2005 2008 2009 2010 Dive School Jet
- Page 211 and 212:
Table 9.5. Results from the SIMPER
- Page 213 and 214:
In general, the inter-annual differ
- Page 215 and 216:
The temporal distribution of M. gal
- Page 217 and 218:
Consistent with the previous years,
- Page 219 and 220:
Saldanha and Langebaan. Results fro
- Page 221 and 222:
The average abundance of the four m
- Page 223 and 224:
State of the Bay 2010: Saldanha Bay
- Page 225 and 226:
State of the Bay 2010: Saldanha Bay
- Page 227 and 228:
Anchor Environmental Figure 10.5. A
- Page 229 and 230:
Anchor Environmental Figure 10.7. A
- Page 231 and 232:
Anchor Environmental Within Big Bay
- Page 233 and 234:
Anchor Environmental 2008 and 2009
- Page 235 and 236:
Anchor Environmental the islands, b
- Page 237 and 238:
Anchor Environmental at Saldanha ar
- Page 239 and 240:
their main prey species, sardines a
- Page 241 and 242:
Anchor Environmental 2009). The eff
- Page 243 and 244:
Anchor Environmental attributed to
- Page 245 and 246:
Number of breeding pairs 800 700 60
- Page 247 and 248:
11.3 Birds of Langebaan Lagoon 11.3
- Page 249 and 250:
Anchor Environmental Figure 11.11.
- Page 251 and 252:
Anchor Environmental for the gannet
- Page 253 and 254:
Taxon Anchor Environmental Occurren
- Page 255 and 256:
Taxon Anchor Environmental Occurren
- Page 257 and 258:
Anchor Environmental 13 MANAGEMENT
- Page 259 and 260:
Anchor Environmental their operatio
- Page 261 and 262:
Anchor Environmental concentrations
- Page 263 and 264:
Anchor Environmental changes that p
- Page 265 and 266:
Anchor Environmental and slight imp
- Page 267 and 268:
Birdlife International. 2010. URL w
- Page 269 and 270:
Anchor Environmental penguins Sphen
- Page 271 and 272:
Anchor Environmental Game, E.T., Gr
- Page 273 and 274:
Anchor Environmental Kerwath, S. E.
- Page 275 and 276:
Anchor Environmental Moldan, A. 197
- Page 277 and 278:
Anchor Environmental Robinson, T.B.
- Page 279 and 280:
Anchor Environmental Tunley KL, Att