

State of the Bay Report 2010-Final - Anchor Environmental
State of the Bay Report 2010-Final - Anchor Environmental
State of the Bay Report 2010-Final - Anchor Environmental

Create successful ePaper yourself
Turn your PDF publications into a flip-book with our unique Google optimized e-Paper software.
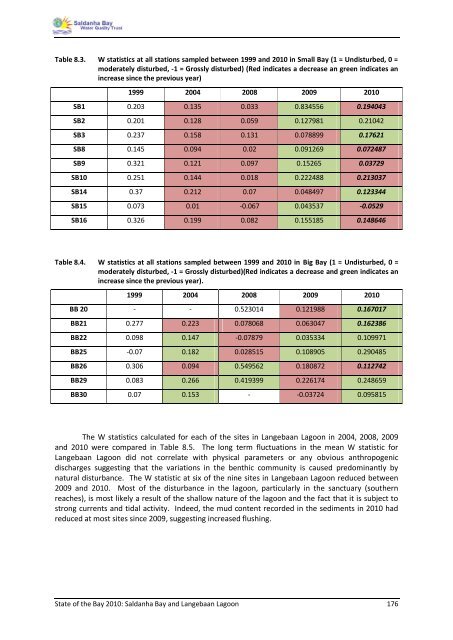
Table 8.3. W statistics at all stations sampled between 1999 and <strong>2010</strong> in Small <strong>Bay</strong> (1 = Undisturbed, 0 =<br />
moderately disturbed, -1 = Grossly disturbed) (Red indicates a decrease an green indicates an<br />
increase since <strong>the</strong> previous year)<br />
1999 2004 2008 2009 <strong>2010</strong><br />
SB1 0.203 0.135 0.033 0.834556 0.194043<br />
SB2 0.201 0.128 0.059 0.127981 0.21042<br />
SB3 0.237 0.158 0.131 0.078899 0.17621<br />
SB8 0.145 0.094 0.02 0.091269 0.072487<br />
SB9 0.321 0.121 0.097 0.15265 0.03729<br />
SB10 0.251 0.144 0.018 0.222488 0.213037<br />
SB14 0.37 0.212 0.07 0.048497 0.123344<br />
SB15 0.073 0.01 -0.067 0.043537 -0.0529<br />
SB16 0.326 0.199 0.082 0.155185 0.148646<br />
Table 8.4. W statistics at all stations sampled between 1999 and <strong>2010</strong> in Big <strong>Bay</strong> (1 = Undisturbed, 0 =<br />
moderately disturbed, -1 = Grossly disturbed)(Red indicates a decrease and green indicates an<br />
increase since <strong>the</strong> previous year).<br />
1999 2004 2008 2009 <strong>2010</strong><br />
BB 20 - - 0.523014 0.121988 0.167017<br />
BB21 0.277 0.223 0.078068 0.063047 0.162386<br />
BB22 0.098 0.147 -0.07879 0.035334 0.109971<br />
BB25 -0.07 0.182 0.028515 0.108905 0.290485<br />
BB26 0.306 0.094 0.549562 0.180872 0.112742<br />
BB29 0.083 0.266 0.419399 0.226174 0.248659<br />
BB30 0.07 0.153 - -0.03724 0.095815<br />
The W statistics calculated for each <strong>of</strong> <strong>the</strong> sites in Langebaan Lagoon in 2004, 2008, 2009<br />
and <strong>2010</strong> were compared in Table 8.5. The long term fluctuations in <strong>the</strong> mean W statistic for<br />
Langebaan Lagoon did not correlate with physical parameters or any obvious anthropogenic<br />
discharges suggesting that <strong>the</strong> variations in <strong>the</strong> benthic community is caused predominantly by<br />
natural disturbance. The W statistic at six <strong>of</strong> <strong>the</strong> nine sites in Langebaan Lagoon reduced between<br />
2009 and <strong>2010</strong>. Most <strong>of</strong> <strong>the</strong> disturbance in <strong>the</strong> lagoon, particularly in <strong>the</strong> sanctuary (sou<strong>the</strong>rn<br />
reaches), is most likely a result <strong>of</strong> <strong>the</strong> shallow nature <strong>of</strong> <strong>the</strong> lagoon and <strong>the</strong> fact that it is subject to<br />
strong currents and tidal activity. Indeed, <strong>the</strong> mud content recorded in <strong>the</strong> sediments in <strong>2010</strong> had<br />
reduced at most sites since 2009, suggesting increased flushing.<br />
<strong>State</strong> <strong>of</strong> <strong>the</strong> <strong>Bay</strong> <strong>2010</strong>: Saldanha <strong>Bay</strong> and Langebaan Lagoon 176


