

State of the Bay Report 2010-Final - Anchor Environmental
State of the Bay Report 2010-Final - Anchor Environmental
State of the Bay Report 2010-Final - Anchor Environmental

Create successful ePaper yourself
Turn your PDF publications into a flip-book with our unique Google optimized e-Paper software.
Relative Area (x 1 000 m 2 )<br />
150<br />
100<br />
50<br />
0<br />
-50<br />
-100<br />
-150<br />
-200<br />
-250<br />
<strong>Anchor</strong> <strong>Environmental</strong><br />
1955 1960 1965 1970 1975 1980 1985 1990 1995 2000<br />
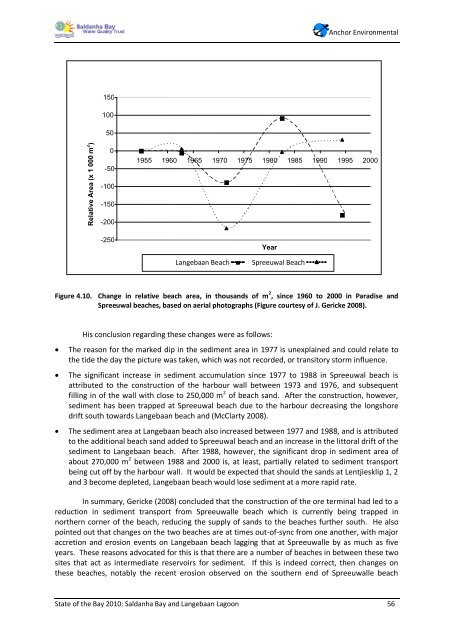
Figure 4.10. Change in relative beach area, in thousands <strong>of</strong> m 2 , since 1960 to 2000 in Paradise and<br />
Spreeuwal beaches, based on aerial photographs (Figure courtesy <strong>of</strong> J. Gericke 2008).<br />
His conclusion regarding <strong>the</strong>se changes were as follows:<br />
The reason for <strong>the</strong> marked dip in <strong>the</strong> sediment area in 1977 is unexplained and could relate to<br />
<strong>the</strong> tide <strong>the</strong> day <strong>the</strong> picture was taken, which was not recorded, or transitory storm influence.<br />
The significant increase in sediment accumulation since 1977 to 1988 in Spreeuwal beach is<br />
attributed to <strong>the</strong> construction <strong>of</strong> <strong>the</strong> harbour wall between 1973 and 1976, and subsequent<br />
filling in <strong>of</strong> <strong>the</strong> wall with close to 250,000 m 2 <strong>of</strong> beach sand. After <strong>the</strong> construction, however,<br />
sediment has been trapped at Spreeuwal beach due to <strong>the</strong> harbour decreasing <strong>the</strong> longshore<br />
drift south towards Langebaan beach and (McClarty 2008).<br />
The sediment area at Langebaan beach also increased between 1977 and 1988, and is attributed<br />
to <strong>the</strong> additional beach sand added to Spreeuwal beach and an increase in <strong>the</strong> littoral drift <strong>of</strong> <strong>the</strong><br />
sediment to Langebaan beach. After 1988, however, <strong>the</strong> significant drop in sediment area <strong>of</strong><br />
about 270,000 m 2 between 1988 and 2000 is, at least, partially related to sediment transport<br />
being cut <strong>of</strong>f by <strong>the</strong> harbour wall. It would be expected that should <strong>the</strong> sands at Lentjiesklip 1, 2<br />
and 3 become depleted, Langebaan beach would lose sediment at a more rapid rate.<br />
In summary, Gericke (2008) concluded that <strong>the</strong> construction <strong>of</strong> <strong>the</strong> ore terminal had led to a<br />
reduction in sediment transport from Spreeuwalle beach which is currently being trapped in<br />
nor<strong>the</strong>rn corner <strong>of</strong> <strong>the</strong> beach, reducing <strong>the</strong> supply <strong>of</strong> sands to <strong>the</strong> beaches fur<strong>the</strong>r south. He also<br />
pointed out that changes on <strong>the</strong> two beaches are at times out-<strong>of</strong>-sync from one ano<strong>the</strong>r, with major<br />
accretion and erosion events on Langebaan beach lagging that at Spreeuwalle by as much as five<br />
years. These reasons advocated for this is that <strong>the</strong>re are a number <strong>of</strong> beaches in between <strong>the</strong>se two<br />
sites that act as intermediate reservoirs for sediment. If this is indeed correct, <strong>the</strong>n changes on<br />
<strong>the</strong>se beaches, notably <strong>the</strong> recent erosion observed on <strong>the</strong> sou<strong>the</strong>rn end <strong>of</strong> Spreeuwalle beach<br />
<strong>State</strong> <strong>of</strong> <strong>the</strong> <strong>Bay</strong> <strong>2010</strong>: Saldanha <strong>Bay</strong> and Langebaan Lagoon 56<br />
Year<br />
Langebaan Beach Spreeuwal Beach


