

State of the Bay Report 2010-Final - Anchor Environmental
State of the Bay Report 2010-Final - Anchor Environmental
State of the Bay Report 2010-Final - Anchor Environmental

Create successful ePaper yourself
Turn your PDF publications into a flip-book with our unique Google optimized e-Paper software.
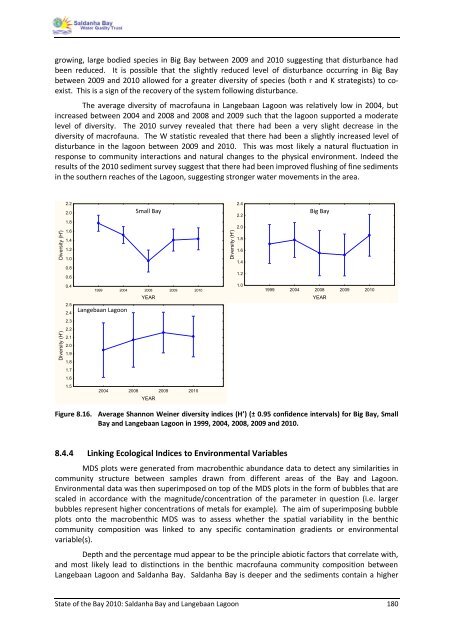
growing, large bodied species in Big <strong>Bay</strong> between 2009 and <strong>2010</strong> suggesting that disturbance had<br />
been reduced. It is possible that <strong>the</strong> slightly reduced level <strong>of</strong> disturbance occurring in Big <strong>Bay</strong><br />
between 2009 and <strong>2010</strong> allowed for a greater diversity <strong>of</strong> species (both r and K strategists) to coexist.<br />
This is a sign <strong>of</strong> <strong>the</strong> recovery <strong>of</strong> <strong>the</strong> system following disturbance.<br />
The average diversity <strong>of</strong> macr<strong>of</strong>auna in Langebaan Lagoon was relatively low in 2004, but<br />
increased between 2004 and 2008 and 2008 and 2009 such that <strong>the</strong> lagoon supported a moderate<br />
level <strong>of</strong> diversity. The <strong>2010</strong> survey revealed that <strong>the</strong>re had been a very slight decrease in <strong>the</strong><br />
diversity <strong>of</strong> macr<strong>of</strong>auna. The W statistic revealed that <strong>the</strong>re had been a slightly increased level <strong>of</strong><br />
disturbance in <strong>the</strong> lagoon between 2009 and <strong>2010</strong>. This was most likely a natural fluctuation in<br />
response to community interactions and natural changes to <strong>the</strong> physical environment. Indeed <strong>the</strong><br />
results <strong>of</strong> <strong>the</strong> <strong>2010</strong> sediment survey suggest that <strong>the</strong>re had been improved flushing <strong>of</strong> fine sediments<br />
in <strong>the</strong> sou<strong>the</strong>rn reaches YEAR; <strong>of</strong> LS Means <strong>the</strong> Lagoon, suggesting stronger water movements YEAR; LS Means in <strong>the</strong> area.<br />
Diversity (H')<br />
Diversity (H')<br />
2.2<br />
2.0<br />
1.8<br />
1.6<br />
1.4<br />
1.2<br />
1.0<br />
0.8<br />
0.6<br />
0.4<br />
2.5<br />
2.4<br />
2.3<br />
2.2<br />
2.1<br />
2.0<br />
1.9<br />
1.8<br />
1.7<br />
1.6<br />
1.5<br />
Current effect: F(4, 54)=7.9270, p=.00004<br />
Effective hypo<strong>the</strong>sis decomposition<br />
Vertical bars denote 0.95 confidence intervals<br />
Include condition: V3="SB"$<br />
1999<br />
YEAR; LS Means<br />
Current effect: F(3, 24)=.39626, p=.75686<br />
Effective 2004 hypo<strong>the</strong>sis 2008 decomposition 2009<br />
Vertical bars denote 0.95 confidence intervals<br />
Include condition: YEAR V3="LL"$<br />
<strong>2010</strong><br />
Langebaan Lagoon<br />
Small <strong>Bay</strong><br />
2004 2008 2009 <strong>2010</strong><br />
YEAR<br />
Current effect: F(4, 33)=.68502, p=.60741<br />
Effective hypo<strong>the</strong>sis decomposition<br />
Vertical bars denote 0.95 confidence intervals<br />
Include condition: V3="BB"$<br />
1999 2004 2008 2009 <strong>2010</strong><br />
<strong>State</strong> <strong>of</strong> <strong>the</strong> <strong>Bay</strong> <strong>2010</strong>: Saldanha <strong>Bay</strong> and Langebaan Lagoon 180<br />
Diversity (H')<br />
2.4<br />
2.2<br />
2.0<br />
1.8<br />
1.6<br />
1.4<br />
1.2<br />
1.0<br />
Big <strong>Bay</strong><br />
Figure 8.16. Average Shannon Weiner diversity indices (H’) (± 0.95 confidence intervals) for Big <strong>Bay</strong>, Small<br />
<strong>Bay</strong> and Langebaan Lagoon in 1999, 2004, 2008, 2009 and <strong>2010</strong>.<br />
8.4.4 Linking Ecological Indices to <strong>Environmental</strong> Variables<br />
MDS plots were generated from macrobenthic abundance data to detect any similarities in<br />
community structure between samples drawn from different areas <strong>of</strong> <strong>the</strong> <strong>Bay</strong> and Lagoon.<br />
<strong>Environmental</strong> data was <strong>the</strong>n superimposed on top <strong>of</strong> <strong>the</strong> MDS plots in <strong>the</strong> form <strong>of</strong> bubbles that are<br />
scaled in accordance with <strong>the</strong> magnitude/concentration <strong>of</strong> <strong>the</strong> parameter in question (i.e. larger<br />
bubbles represent higher concentrations <strong>of</strong> metals for example). The aim <strong>of</strong> superimposing bubble<br />
plots onto <strong>the</strong> macrobenthic MDS was to assess whe<strong>the</strong>r <strong>the</strong> spatial variability in <strong>the</strong> benthic<br />
community composition was linked to any specific contamination gradients or environmental<br />
variable(s).<br />
Depth and <strong>the</strong> percentage mud appear to be <strong>the</strong> principle abiotic factors that correlate with,<br />
and most likely lead to distinctions in <strong>the</strong> benthic macr<strong>of</strong>auna community composition between<br />
Langebaan Lagoon and Saldanha <strong>Bay</strong>. Saldanha <strong>Bay</strong> is deeper and <strong>the</strong> sediments contain a higher<br />
YEAR


