

State of the Bay Report 2010-Final - Anchor Environmental
State of the Bay Report 2010-Final - Anchor Environmental
State of the Bay Report 2010-Final - Anchor Environmental

Create successful ePaper yourself
Turn your PDF publications into a flip-book with our unique Google optimized e-Paper software.
<strong>Anchor</strong> <strong>Environmental</strong><br />
The concentration <strong>of</strong> phosphorus in <strong>the</strong> effluent has only been measured since October<br />
2007 showing a distinct seasonal pattern, with <strong>the</strong> highest values occurring mostly during <strong>the</strong><br />
summer months and lowest values in winter. This is consistent with <strong>the</strong> higher influx <strong>of</strong> visitors<br />
during summer. In recent years values have remained below <strong>the</strong> allowable limit <strong>of</strong> 10mg/l (Figure<br />
20).<br />
Chlorine gas, generated through a process <strong>of</strong> electrolysis, is toxic to most organisms and is<br />
used to sterilise <strong>the</strong> final effluent (i.e. kill bacteria and o<strong>the</strong>r pathogens present in <strong>the</strong> effluent)<br />
before it is released into settling ponds or <strong>the</strong> environment. Chlorine breaks down naturally through<br />
reaction with organic matter and in <strong>the</strong> presence <strong>of</strong> sunlight, but must not exceed a concentration<br />
0.25 mg/l in terms <strong>of</strong> <strong>the</strong> general authorisation under which <strong>the</strong> Langebaan WWTW operates. The<br />
frequency <strong>of</strong> exeedence for this parameters since 2003 is 47.3% (i.e. nearly 50% <strong>of</strong> <strong>the</strong> readings are<br />
above <strong>the</strong> allowable limit).<br />
4.3.6.2 Water quality parameters associated with <strong>the</strong> Langebaan WWTW<br />
Water quality parameters associated with effluent from <strong>the</strong> Langebaan WWTW have only<br />
been measured since June 2009 (Figure 4.20-Figure 4.22). Faecal coliforms counts have exceeded<br />
<strong>the</strong> allowable limits specified on 4 occasions since 2009, which correspond to 19% <strong>of</strong> time (Figure<br />
4.21). Total Suspended Solids have only once exceeded <strong>the</strong> allowable limits, while measurements<br />
for Chemical Oxygen Demand exceeded allowable limits on 29% <strong>of</strong> <strong>the</strong> occasions (Figure 4.21).<br />
Flow (m 3 /day)<br />
7000<br />
6000<br />
5000<br />
4000<br />
3000<br />
2000<br />
1000<br />
0<br />
May-09<br />
Aug-09<br />
Dec-09<br />
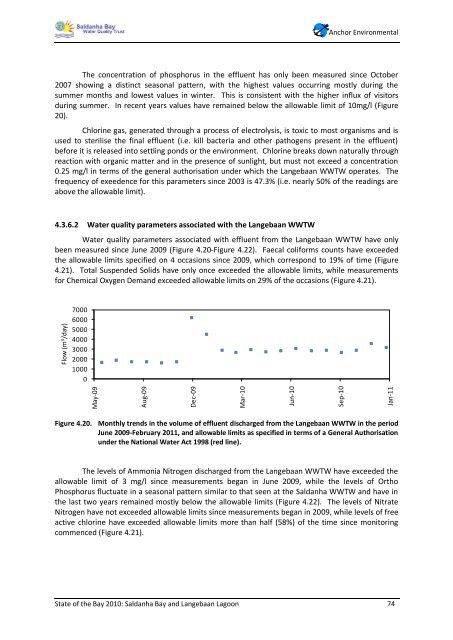
Figure 4.20. Monthly trends in <strong>the</strong> volume <strong>of</strong> effluent discharged from <strong>the</strong> Langebaan WWTW in <strong>the</strong> period<br />
June 2009-February 2011, and allowable limits as specified in terms <strong>of</strong> a General Authorisation<br />
under <strong>the</strong> National Water Act 1998 (red line).<br />
The levels <strong>of</strong> Ammonia Nitrogen discharged from <strong>the</strong> Langebaan WWTW have exceeded <strong>the</strong><br />
allowable limit <strong>of</strong> 3 mg/l since measurements began in June 2009, while <strong>the</strong> levels <strong>of</strong> Ortho<br />
Phosphorus fluctuate in a seasonal pattern similar to that seen at <strong>the</strong> Saldanha WWTW and have in<br />
<strong>the</strong> last two years remained mostly below <strong>the</strong> allowable limits (Figure 4.22). The levels <strong>of</strong> Nitrate<br />
Nitrogen have not exceeded allowable limits since measurements began in 2009, while levels <strong>of</strong> free<br />
active chlorine have exceeded allowable limits more than half (58%) <strong>of</strong> <strong>the</strong> time since monitoring<br />
commenced (Figure 4.21).<br />
<strong>State</strong> <strong>of</strong> <strong>the</strong> <strong>Bay</strong> <strong>2010</strong>: Saldanha <strong>Bay</strong> and Langebaan Lagoon 74<br />
Mar-10<br />
Jun-10<br />
Sep-10<br />
Jan-11


