

State of the Bay Report 2010-Final - Anchor Environmental
State of the Bay Report 2010-Final - Anchor Environmental
State of the Bay Report 2010-Final - Anchor Environmental

You also want an ePaper? Increase the reach of your titles
YUMPU automatically turns print PDFs into web optimized ePapers that Google loves.
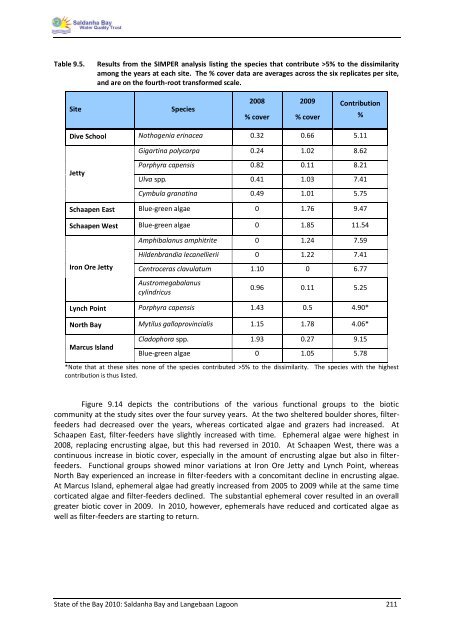
Table 9.5. Results from <strong>the</strong> SIMPER analysis listing <strong>the</strong> species that contribute >5% to <strong>the</strong> dissimilarity<br />
among <strong>the</strong> years at each site. The % cover data are averages across <strong>the</strong> six replicates per site,<br />
and are on <strong>the</strong> fourth-root transformed scale.<br />
Site Species<br />
<strong>State</strong> <strong>of</strong> <strong>the</strong> <strong>Bay</strong> <strong>2010</strong>: Saldanha <strong>Bay</strong> and Langebaan Lagoon 211<br />
2008<br />
% cover<br />
2009<br />
% cover<br />
Contribution<br />
Dive School Nothogenia erinacea 0.32 0.66 5.11<br />
Jetty<br />
Gigartina polycarpa 0.24 1.02 8.62<br />
Porphyra capensis 0.82 0.11 8.21<br />
Ulva spp. 0.41 1.03 7.41<br />
Cymbula granatina 0.49 1.01 5.75<br />
Schaapen East Blue-green algae 0 1.76 9.47<br />
Schaapen West Blue-green algae 0 1.85 11.54<br />
Iron Ore Jetty<br />
Amphibalanus amphitrite 0 1.24 7.59<br />
Hildenbrandia lecanellierii 0 1.22 7.41<br />
Centroceras clavulatum 1.10 0 6.77<br />
Austromegabalanus<br />
cylindricus<br />
0.96 0.11 5.25<br />
Lynch Point Porphyra capensis 1.43 0.5 4.90*<br />
North <strong>Bay</strong> Mytilus galloprovincialis 1.15 1.78 4.06*<br />
Marcus Island<br />
Cladophora spp. 1.93 0.27 9.15<br />
Blue-green algae 0 1.05 5.78<br />
*Note that at <strong>the</strong>se sites none <strong>of</strong> <strong>the</strong> species contributed >5% to <strong>the</strong> dissimilarity. The species with <strong>the</strong> highest<br />
contribution is thus listed.<br />
Figure 9.14 depicts <strong>the</strong> contributions <strong>of</strong> <strong>the</strong> various functional groups to <strong>the</strong> biotic<br />
community at <strong>the</strong> study sites over <strong>the</strong> four survey years. At <strong>the</strong> two sheltered boulder shores, filterfeeders<br />
had decreased over <strong>the</strong> years, whereas corticated algae and grazers had increased. At<br />
Schaapen East, filter-feeders have slightly increased with time. Ephemeral algae were highest in<br />
2008, replacing encrusting algae, but this had reversed in <strong>2010</strong>. At Schaapen West, <strong>the</strong>re was a<br />
continuous increase in biotic cover, especially in <strong>the</strong> amount <strong>of</strong> encrusting algae but also in filterfeeders.<br />
Functional groups showed minor variations at Iron Ore Jetty and Lynch Point, whereas<br />
North <strong>Bay</strong> experienced an increase in filter-feeders with a concomitant decline in encrusting algae.<br />
At Marcus Island, ephemeral algae had greatly increased from 2005 to 2009 while at <strong>the</strong> same time<br />
corticated algae and filter-feeders declined. The substantial ephemeral cover resulted in an overall<br />
greater biotic cover in 2009. In <strong>2010</strong>, however, ephemerals have reduced and corticated algae as<br />
well as filter-feeders are starting to return.<br />
%


