State of the Bay Report 2010-Final - Anchor Environmental
State of the Bay Report 2010-Final - Anchor Environmental
State of the Bay Report 2010-Final - Anchor Environmental
You also want an ePaper? Increase the reach of your titles
YUMPU automatically turns print PDFs into web optimized ePapers that Google loves.
<strong>Anchor</strong> <strong>Environmental</strong><br />
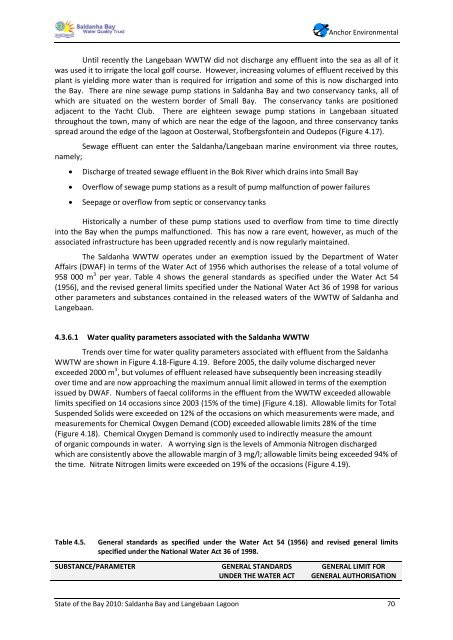
Until recently <strong>the</strong> Langebaan WWTW did not discharge any effluent into <strong>the</strong> sea as all <strong>of</strong> it<br />
was used it to irrigate <strong>the</strong> local golf course. However, increasing volumes <strong>of</strong> effluent received by this<br />
plant is yielding more water than is required for irrigation and some <strong>of</strong> this is now discharged into<br />
<strong>the</strong> <strong>Bay</strong>. There are nine sewage pump stations in Saldanha <strong>Bay</strong> and two conservancy tanks, all <strong>of</strong><br />
which are situated on <strong>the</strong> western border <strong>of</strong> Small <strong>Bay</strong>. The conservancy tanks are positioned<br />
adjacent to <strong>the</strong> Yacht Club. There are eighteen sewage pump stations in Langebaan situated<br />
throughout <strong>the</strong> town, many <strong>of</strong> which are near <strong>the</strong> edge <strong>of</strong> <strong>the</strong> lagoon, and three conservancy tanks<br />
spread around <strong>the</strong> edge <strong>of</strong> <strong>the</strong> lagoon at Oosterwal, St<strong>of</strong>bergsfontein and Oudepos (Figure 4.17).<br />
Sewage effluent can enter <strong>the</strong> Saldanha/Langebaan marine environment via three routes,<br />
namely;<br />
Discharge <strong>of</strong> treated sewage effluent in <strong>the</strong> Bok River which drains into Small <strong>Bay</strong><br />
Overflow <strong>of</strong> sewage pump stations as a result <strong>of</strong> pump malfunction <strong>of</strong> power failures<br />
Seepage or overflow from septic or conservancy tanks<br />
Historically a number <strong>of</strong> <strong>the</strong>se pump stations used to overflow from time to time directly<br />
into <strong>the</strong> <strong>Bay</strong> when <strong>the</strong> pumps malfunctioned. This has now a rare event, however, as much <strong>of</strong> <strong>the</strong><br />
associated infrastructure has been upgraded recently and is now regularly maintained.<br />
The Saldanha WWTW operates under an exemption issued by <strong>the</strong> Department <strong>of</strong> Water<br />
Affairs (DWAF) in terms <strong>of</strong> <strong>the</strong> Water Act <strong>of</strong> 1956 which authorises <strong>the</strong> release <strong>of</strong> a total volume <strong>of</strong><br />
958 000 m 3 per year. Table 4 shows <strong>the</strong> general standards as specified under <strong>the</strong> Water Act 54<br />
(1956), and <strong>the</strong> revised general limits specified under <strong>the</strong> National Water Act 36 <strong>of</strong> 1998 for various<br />
o<strong>the</strong>r parameters and substances contained in <strong>the</strong> released waters <strong>of</strong> <strong>the</strong> WWTW <strong>of</strong> Saldanha and<br />
Langebaan.<br />
4.3.6.1 Water quality parameters associated with <strong>the</strong> Saldanha WWTW<br />
Trends over time for water quality parameters associated with effluent from <strong>the</strong> Saldanha<br />
WWTW are shown in Figure 4.18-Figure 4.19. Before 2005, <strong>the</strong> daily volume discharged never<br />
exceeded 2000 m 3 , but volumes <strong>of</strong> effluent released have subsequently been increasing steadily<br />
over time and are now approaching <strong>the</strong> maximum annual limit allowed in terms <strong>of</strong> <strong>the</strong> exemption<br />
issued by DWAF. Numbers <strong>of</strong> faecal coliforms in <strong>the</strong> effluent from <strong>the</strong> WWTW exceeded allowable<br />
limits specified on 14 occasions since 2003 (15% <strong>of</strong> <strong>the</strong> time) (Figure 4.18). Allowable limits for Total<br />
Suspended Solids were exceeded on 12% <strong>of</strong> <strong>the</strong> occasions on which measurements were made, and<br />
measurements for Chemical Oxygen Demand (COD) exceeded allowable limits 28% <strong>of</strong> <strong>the</strong> time<br />
(Figure 4.18). Chemical Oxygen Demand is commonly used to indirectly measure <strong>the</strong> amount<br />
<strong>of</strong> organic compounds in water. A worrying sign is <strong>the</strong> levels <strong>of</strong> Ammonia Nitrogen discharged<br />
which are consistently above <strong>the</strong> allowable margin <strong>of</strong> 3 mg/l; allowable limits being exceeded 94% <strong>of</strong><br />
<strong>the</strong> time. Nitrate Nitrogen limits were exceeded on 19% <strong>of</strong> <strong>the</strong> occasions (Figure 4.19).<br />
Table 4.5. General standards as specified under <strong>the</strong> Water Act 54 (1956) and revised general limits<br />
specified under <strong>the</strong> National Water Act 36 <strong>of</strong> 1998.<br />
SUBSTANCE/PARAMETER GENERAL STANDARDS<br />
UNDER THE WATER ACT<br />
GENERAL LIMIT FOR<br />
GENERAL AUTHORISATION<br />
<strong>State</strong> <strong>of</strong> <strong>the</strong> <strong>Bay</strong> <strong>2010</strong>: Saldanha <strong>Bay</strong> and Langebaan Lagoon 70


