cameron county/matamoros - blue - The University of Texas at ...
cameron county/matamoros - blue - The University of Texas at ...
cameron county/matamoros - blue - The University of Texas at ...

Create successful ePaper yourself
Turn your PDF publications into a flip-book with our unique Google optimized e-Paper software.
UTB-CBIRD Report: “At <strong>The</strong> Crossroads” Economic Development 93<br />
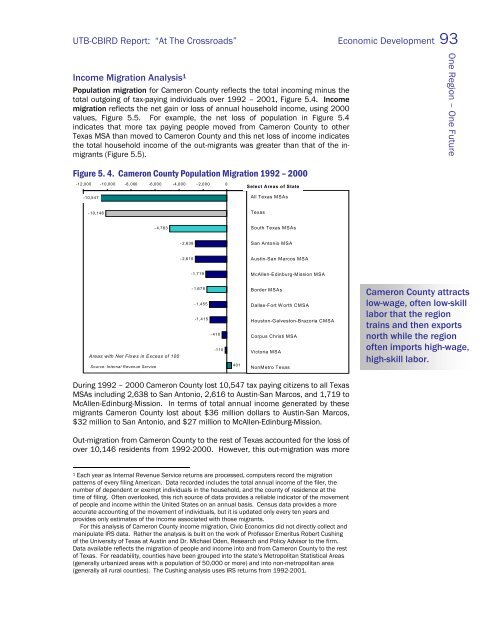
Income Migr<strong>at</strong>ion Analysis 1<br />
Popul<strong>at</strong>ion migr<strong>at</strong>ion for Cameron County reflects the total incoming minus the<br />
total outgoing <strong>of</strong> tax-paying individuals over 1992 – 2001, Figure 5.4. Income<br />
migr<strong>at</strong>ion reflects the net gain or loss <strong>of</strong> annual household income, using 2000<br />
values, Figure 5.5. For example, the net loss <strong>of</strong> popul<strong>at</strong>ion in Figure 5.4<br />
indic<strong>at</strong>es th<strong>at</strong> more tax paying people moved from Cameron County to other<br />
<strong>Texas</strong> MSA than moved to Cameron County and this net loss <strong>of</strong> income indic<strong>at</strong>es<br />
the total household income <strong>of</strong> the out-migrants was gre<strong>at</strong>er than th<strong>at</strong> <strong>of</strong> the inmigrants<br />
(Figure 5.5).<br />
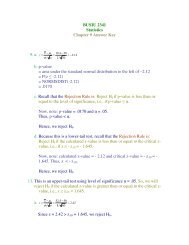
Figure 5. 4. Cameron County Popul<strong>at</strong>ion Migr<strong>at</strong>ion 1992 – 2000<br />
Cameron Co. Popul<strong>at</strong>ion Migr<strong>at</strong>ion, 1992-2000<br />
-12,000 -10,000 -8,000 -6,000 -4,000 -2,000 0 2,000<br />
Select Areas <strong>of</strong> St<strong>at</strong>e<br />
-10,547<br />
-10,146<br />
-4,783<br />
Areas with Net Flows in Excess <strong>of</strong> 100<br />
Source: Internal Revenue Service<br />
-2,638<br />
-2,616<br />
-1,719<br />
-1,678<br />
-1,455<br />
-1,415<br />
-410<br />
-110<br />
401<br />
All <strong>Texas</strong> MSAs<br />
<strong>Texas</strong><br />
South <strong>Texas</strong> MSAs<br />
San Antonio MSA<br />
Austin-San Marcos MSA<br />
McAllen-Edinburg-Mission MSA<br />
Border MSAs<br />
Dallas-Fort W orth CMSA<br />
Houston-Galveston-Brazoria CMSA<br />
Corpus Christi MSA<br />
Victoria MSA<br />
NonMetro <strong>Texas</strong><br />
During 1992 – 2000 Cameron County lost 10,547 tax paying citizens to all <strong>Texas</strong><br />
MSAs including 2,638 to San Antonio, 2,616 to Austin-San Marcos, and 1,719 to<br />
McAllen-Edinburg-Mission. In terms <strong>of</strong> total annual income gener<strong>at</strong>ed by these<br />
migrants Cameron County lost about $36 million dollars to Austin-San Marcos,<br />
$32 million to San Antonio, and $27 million to McAllen-Edinburg-Mission.<br />
Out-migr<strong>at</strong>ion from Cameron County to the rest <strong>of</strong> <strong>Texas</strong> accounted for the loss <strong>of</strong><br />
over 10,146 residents from 1992-2000. However, this out-migr<strong>at</strong>ion was more<br />
1 Each year as Internal Revenue Service returns are processed, computers record the migr<strong>at</strong>ion<br />
p<strong>at</strong>terns <strong>of</strong> every filing American. D<strong>at</strong>a recorded includes the total annual income <strong>of</strong> the filer, the<br />
number <strong>of</strong> dependent or exempt individuals in the household, and the <strong>county</strong> <strong>of</strong> residence <strong>at</strong> the<br />
time <strong>of</strong> filing. Often overlooked, this rich source <strong>of</strong> d<strong>at</strong>a provides a reliable indic<strong>at</strong>or <strong>of</strong> the movement<br />
<strong>of</strong> people and income within the United St<strong>at</strong>es on an annual basis. Census d<strong>at</strong>a provides a more<br />
accur<strong>at</strong>e accounting <strong>of</strong> the movement <strong>of</strong> individuals, but it is upd<strong>at</strong>ed only every ten years and<br />
provides only estim<strong>at</strong>es <strong>of</strong> the income associ<strong>at</strong>ed with those migrants.<br />
For this analysis <strong>of</strong> Cameron County income migr<strong>at</strong>ion, Civic Economics did not directly collect and<br />
manipul<strong>at</strong>e IRS d<strong>at</strong>a. R<strong>at</strong>her the analysis is built on the work <strong>of</strong> Pr<strong>of</strong>essor Emeritus Robert Cushing<br />
<strong>of</strong> the <strong>University</strong> <strong>of</strong> <strong>Texas</strong> <strong>at</strong> Austin and Dr. Michael Oden, Research and Policy Advisor to the firm.<br />
D<strong>at</strong>a available reflects the migr<strong>at</strong>ion <strong>of</strong> people and income into and from Cameron County to the rest<br />
<strong>of</strong> <strong>Texas</strong>. For readability, counties have been grouped into the st<strong>at</strong>e’s Metropolitan St<strong>at</strong>istical Areas<br />
(generally urbanized areas with a popul<strong>at</strong>ion <strong>of</strong> 50,000 or more) and into non-metropolitan area<br />
(generally all rural counties). <strong>The</strong> Cushing analysis uses IRS returns from 1992-2001.<br />
One Region – One Future<br />
Cameron County <strong>at</strong>tracts<br />
low-wage, <strong>of</strong>ten low-skill<br />
labor th<strong>at</strong> the region<br />
trains and then exports<br />
north while the region<br />
<strong>of</strong>ten imports high-wage,<br />
high-skill labor.