cameron county/matamoros - blue - The University of Texas at ...
cameron county/matamoros - blue - The University of Texas at ...
cameron county/matamoros - blue - The University of Texas at ...

You also want an ePaper? Increase the reach of your titles
YUMPU automatically turns print PDFs into web optimized ePapers that Google loves.
UTB-CBIRD Report: “At the Crossroads” Demographics 16<br />
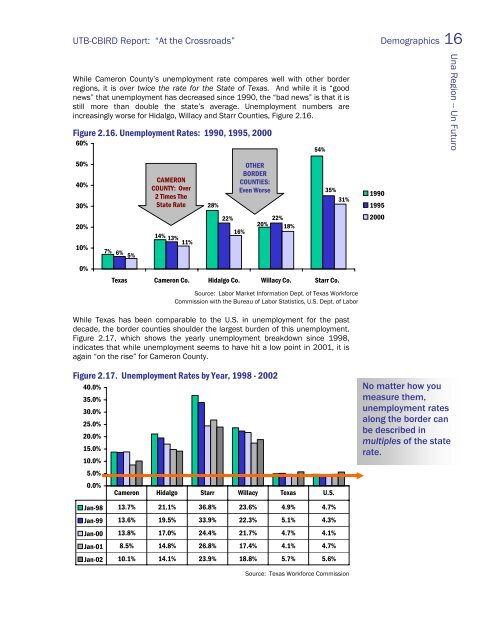
While Cameron County’s unemployment r<strong>at</strong>e compares well with other border<br />
regions, it is over twice the r<strong>at</strong>e for the St<strong>at</strong>e <strong>of</strong> <strong>Texas</strong>. And while it is “good<br />
news” th<strong>at</strong> unemployment has decreased since 1990, the “bad news” is th<strong>at</strong> it is<br />
still more than double the st<strong>at</strong>e’s average. Unemployment numbers are<br />
increasingly worse for Hidalgo, Willacy and Starr Counties, Figure 2.16.<br />
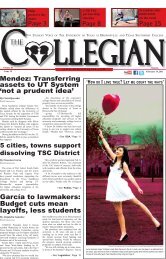
Figure 2.16. Unemployment R<strong>at</strong>es: 1990, 1995, 2000<br />
60%<br />
50%<br />
40%<br />
30%<br />
20%<br />
10%<br />
0%<br />
40.0%<br />
35.0%<br />
30.0%<br />
25.0%<br />
20.0%<br />
15.0%<br />
10.0%<br />
5.0%<br />
0.0%<br />
7%<br />
6%<br />
5%<br />
CAMERON<br />
COUNTY: Over<br />
2 Times <strong>The</strong><br />
St<strong>at</strong>e R<strong>at</strong>e<br />
14% 13%<br />
11%<br />
OTHER<br />
BORDER<br />
COUNTIES:<br />
Even Worse<br />
28%<br />
22%<br />
16%<br />
20%<br />
22%<br />
18%<br />
<strong>Texas</strong> Cameron Co. Hidalgo Co. Willacy Co. Starr Co.<br />
Cameron Hidalgo Starr Willacy <strong>Texas</strong> U.S.<br />
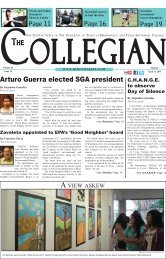
Jan-98 13.7% 21.1% 36.8% 23.6% 4.9% 4.7%<br />
Jan-99 13.6% 19.5% 33.9% 22.3% 5.1% 4.3%<br />
Jan-00 13.8% 17.0% 24.4% 21.7% 4.7% 4.1%<br />
Jan-01 8.5% 14.8% 26.8% 17.4% 4.1% 4.7%<br />
Jan-02 10.1% 14.1% 23.9% 18.8% 5.7% 5.6%<br />
54%<br />
35%<br />
31%<br />
Source: Labor Market Inform<strong>at</strong>ion Dept. <strong>of</strong> <strong>Texas</strong> Workforce<br />
Commission with the Bureau <strong>of</strong> Labor St<strong>at</strong>istics, U.S. Dept. <strong>of</strong> Labor<br />
While <strong>Texas</strong> has been comparable to the U.S. in unemployment for the past<br />
decade, the border counties shoulder the largest burden <strong>of</strong> this unemployment.<br />
Figure 2.17, which shows the yearly unemployment breakdown since 1998,<br />
indic<strong>at</strong>es th<strong>at</strong> while unemployment seems to have hit a low point in 2001, it is<br />
again “on the rise” for Cameron County.<br />
Figure 2.17. Unemployment R<strong>at</strong>es by Year, 1998 - 2002<br />
Source: <strong>Texas</strong> Workforce Commission<br />
1990<br />
1995<br />
2000<br />
No m<strong>at</strong>ter how you<br />
measure them,<br />
unemployment r<strong>at</strong>es<br />
along the border can<br />
be described in<br />
multiples <strong>of</strong> the st<strong>at</strong>e<br />
r<strong>at</strong>e.<br />
Una Region -- Un Futuro