cameron county/matamoros - blue - The University of Texas at ...
cameron county/matamoros - blue - The University of Texas at ...
cameron county/matamoros - blue - The University of Texas at ...

Create successful ePaper yourself
Turn your PDF publications into a flip-book with our unique Google optimized e-Paper software.
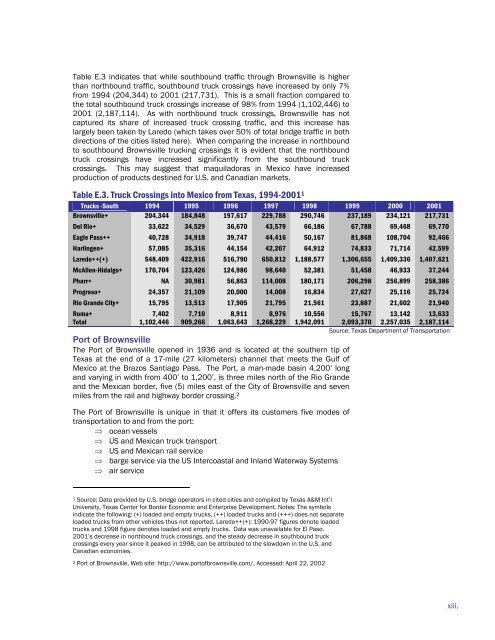
Table E.3 indic<strong>at</strong>es th<strong>at</strong> while southbound traffic through Brownsville is higher<br />
than northbound traffic, southbound truck crossings have increased by only 7%<br />
from 1994 (204,344) to 2001 (217,731). This is a small fraction compared to<br />
the total southbound truck crossings increase <strong>of</strong> 98% from 1994 (1,102,446) to<br />
2001 (2,187,114). As with northbound truck crossings, Brownsville has not<br />
captured its share <strong>of</strong> increased truck crossing traffic, and this increase has<br />
largely been taken by Laredo (which takes over 50% <strong>of</strong> total bridge traffic in both<br />
directions <strong>of</strong> the cities listed here). When comparing the increase in northbound<br />
to southbound Brownsville trucking crossings it is evident th<strong>at</strong> the northbound<br />
truck crossings have increased significantly from the southbound truck<br />
crossings. This may suggest th<strong>at</strong> maquiladoras in Mexico have increased<br />
production <strong>of</strong> products destined for U.S. and Canadian markets.<br />
Table E.3. Truck Crossings into Mexico from <strong>Texas</strong>, 1994-2001 1<br />
Trucks -South 1994 1995 1996 1997 1998 1999 2000 2001<br />
Brownsville+ 204,344 184,848 197,617 229,788 290,746 237,189 234,121 217,731<br />
Del Rio+ 33,622 34,529 36,670 43,579 66,186 67,788 69,468 69,770<br />
Eagle Pass++ 40,728 34,918 39,747 44,416 50,167 81,868 108,704 92,466<br />
Harlingen+ 57,085 35,316 44,154 42,207 64,912 74,833 71,714 42,599<br />
Laredo++(+) 548,409 422,916 516,790 650,812 1,188,577 1,306,655 1,409,336 1,407,621<br />
McAllen-Hidalgo+ 170,704 123,426 124,986 98,640 52,381 51,458 46,933 37,244<br />
Pharr+ NA 30,981 56,863 114,008 180,171 206,298 256,899 258,386<br />
Progreso+ 24,357 21,109 20,000 14,008 16,834 27,627 25,116 25,724<br />
Rio Grande City+ 15,795 13,513 17,905 21,795 21,561 23,887 21,602 21,940<br />
Roma+ 7,402 7,710 8,911 8,976 10,556 15,767 13,142 13,633<br />
Total 1,102,446 909,266 1,063,643 1,268,229 1,942,091 2,093,370 2,257,035 2,187,114<br />
Source: <strong>Texas</strong> Department <strong>of</strong> Transport<strong>at</strong>ion<br />
Port <strong>of</strong> Brownsville<br />
<strong>The</strong> Port <strong>of</strong> Brownsville opened in 1936 and is loc<strong>at</strong>ed <strong>at</strong> the southern tip <strong>of</strong><br />
<strong>Texas</strong> <strong>at</strong> the end <strong>of</strong> a 17-mile (27 kilometers) channel th<strong>at</strong> meets the Gulf <strong>of</strong><br />
Mexico <strong>at</strong> the Brazos Santiago Pass. <strong>The</strong> Port, a man-made basin 4,200’ long<br />
and varying in width from 400’ to 1,200’, is three miles north <strong>of</strong> the Rio Grande<br />
and the Mexican border, five (5) miles east <strong>of</strong> the City <strong>of</strong> Brownsville and seven<br />
miles from the rail and highway border crossing. 2<br />
<strong>The</strong> Port <strong>of</strong> Brownsville is unique in th<strong>at</strong> it <strong>of</strong>fers its customers five modes <strong>of</strong><br />
transport<strong>at</strong>ion to and from the port:<br />
⇒ ocean vessels<br />
⇒ US and Mexican truck transport<br />
⇒ US and Mexican rail service<br />
⇒ barge service via the US Intercoastal and Inland W<strong>at</strong>erway Systems<br />
⇒ air service<br />
1 Source: D<strong>at</strong>a provided by U.S. bridge oper<strong>at</strong>ors in cited cities and compiled by <strong>Texas</strong> A&M Int’l<br />
<strong>University</strong>, <strong>Texas</strong> Center for Border Economic and Enterprise Development. Notes: <strong>The</strong> symbols<br />
indic<strong>at</strong>e the following: (+) loaded and empty trucks, (++) loaded trucks and (+++) does not separ<strong>at</strong>e<br />
loaded trucks from other vehicles thus not reported. Laredo++(+): 1990-97 figures denote loaded<br />
trucks and 1998 figure denotes loaded and empty trucks. D<strong>at</strong>a was unavailable for El Paso.<br />
2001’s decrease in northbound truck crossings, and the steady decrease in southbound truck<br />
crossings every year since it peaked in 1998, can be <strong>at</strong>tributed to the slowdown in the U.S. and<br />
Canadian economies.<br />
2 Port <strong>of</strong> Brownsville, Web site: http://www.port<strong>of</strong>brownsville.com/, Accessed: April 22, 2002<br />
xiii.