cameron county/matamoros - blue - The University of Texas at ...
cameron county/matamoros - blue - The University of Texas at ...
cameron county/matamoros - blue - The University of Texas at ...
You also want an ePaper? Increase the reach of your titles
YUMPU automatically turns print PDFs into web optimized ePapers that Google loves.
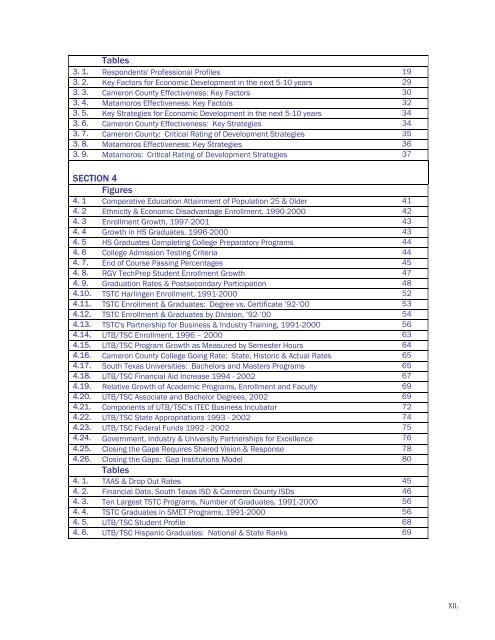
Tables<br />
3. 1. Respondents' Pr<strong>of</strong>essional Pr<strong>of</strong>iles 19<br />
3. 2. Key Factors for Economic Development in the next 5-10 years 29<br />
3. 3. Cameron County Effectiveness: Key Factors 30<br />
3. 4. M<strong>at</strong>amoros Effectiveness: Key Factors 32<br />
3. 5. Key Str<strong>at</strong>egies for Economic Development in the next 5-10 years 34<br />
3. 6. Cameron County Effectiveness: Key Str<strong>at</strong>egies 34<br />
3. 7. Cameron County: Critical R<strong>at</strong>ing <strong>of</strong> Development Str<strong>at</strong>egies 35<br />
3. 8. M<strong>at</strong>amoros Effectiveness: Key Str<strong>at</strong>egies 36<br />
3. 9. M<strong>at</strong>amoros: Critical R<strong>at</strong>ing <strong>of</strong> Development Str<strong>at</strong>egies 37<br />
SECTION 4<br />
Figures<br />
4. 1 Compar<strong>at</strong>ive Educ<strong>at</strong>ion Attainment <strong>of</strong> Popul<strong>at</strong>ion 25 & Older 41<br />
4. 2 Ethnicity & Economic Disadvantage Enrollment, 1990-2000 42<br />
4. 3 Enrollment Growth, 1997-2001 43<br />
4. 4 Growth in HS Gradu<strong>at</strong>es, 1996-2000 43<br />
4. 5 HS Gradu<strong>at</strong>es Completing College Prepar<strong>at</strong>ory Programs 44<br />
4. 6 College Admission Testing Criteria 44<br />
4. 7. End <strong>of</strong> Course Passing Percentages 45<br />
4. 8. RGV TechPrep Student Enrollment Growth 47<br />
4. 9. Gradu<strong>at</strong>ion R<strong>at</strong>es & Postsecondary Particip<strong>at</strong>ion 48<br />
4.10. TSTC Harlingen Enrollment, 1991-2000 52<br />
4.11. TSTC Enrollment & Gradu<strong>at</strong>es: Degree vs. Certific<strong>at</strong>e ’92-‘00 53<br />
4.12. TSTC Enrollment & Gradu<strong>at</strong>es by Division, ’92-‘00 54<br />
4.13. TSTC's Partnership for Business & Industry Training, 1991-2000 56<br />
4.14. UTB/TSC Enrollment, 1996 – 2000 63<br />
4.15. UTB/TSC Program Growth as Measured by Semester Hours 64<br />
4.16. Cameron County College Going R<strong>at</strong>e: St<strong>at</strong>e, Historic & Actual R<strong>at</strong>es 65<br />
4.17. South <strong>Texas</strong> Universities: Bachelors and Masters Programs 65<br />
4.18. UTB/TSC Financial Aid Increase 1994 - 2002 67<br />
4.19. Rel<strong>at</strong>ive Growth <strong>of</strong> Academic Programs, Enrollment and Faculty 69<br />
4.20. UTB/TSC Associ<strong>at</strong>e and Bachelor Degrees, 2002 69<br />
4.21. Components <strong>of</strong> UTB/TSC’s ITEC Business Incub<strong>at</strong>or 72<br />
4.22. UTB/TSC St<strong>at</strong>e Appropri<strong>at</strong>ions 1993 - 2002 74<br />
4.23. UTB/TSC Federal Funds 1992 - 2002 75<br />
4.24. Government, Industry & <strong>University</strong> Partnerships for Excellence<br />
76<br />
4.25. Closing the Gaps Requires Shared Vision & Response 78<br />
4.26. Closing the Gaps: Gap Institutions Model<br />
Tables<br />
80<br />
4. 1. TAAS & Drop Out R<strong>at</strong>es 45<br />
4. 2. Financial D<strong>at</strong>a, South <strong>Texas</strong> ISD & Cameron County ISDs 46<br />
4. 3. Ten Largest TSTC Programs, Number <strong>of</strong> Gradu<strong>at</strong>es, 1991-2000 56<br />
4. 4. TSTC Gradu<strong>at</strong>es in SMET Programs, 1991-2000 56<br />
4. 5. UTB/TSC Student Pr<strong>of</strong>ile 68<br />
4. 6. UTB/TSC Hispanic Gradu<strong>at</strong>es: N<strong>at</strong>ional & St<strong>at</strong>e Ranks 69<br />
XII.


