cameron county/matamoros - blue - The University of Texas at ...
cameron county/matamoros - blue - The University of Texas at ...
cameron county/matamoros - blue - The University of Texas at ...

Create successful ePaper yourself
Turn your PDF publications into a flip-book with our unique Google optimized e-Paper software.
APPENDIX D. SHIFT-SHARE ANALYSIS<br />
Shift-share analysis is one way to account for the competitiveness <strong>of</strong> a region’s<br />
industries and to analyze the potential contribution to its future economic base.<br />
This analysis is utilized to identify employment changes in various business<br />
sectors over a specific period <strong>of</strong> time. Shift-share indic<strong>at</strong>es thre<strong>at</strong>s and<br />
opportunities based on regional, st<strong>at</strong>e, and industrial influences.<br />
Shift-share analysis breaks down employment growth (or decline) in a region over<br />
a given time period into three components: (1) a n<strong>at</strong>ional growth effect, which<br />
assumes the growth (or loss) <strong>of</strong> employment in a region mirrors the n<strong>at</strong>ional<br />
trend, (2) an industry mix effect, which is the amount <strong>of</strong> change in employment<br />
the region would have experienced had each <strong>of</strong> its industries grown <strong>at</strong> their<br />
n<strong>at</strong>ional r<strong>at</strong>es, less the n<strong>at</strong>ional growth effect, and (3) a competitive effect, which<br />
is the difference between the actual change in employment and the employment<br />
change to be expected if each industrial sector grew <strong>at</strong> the n<strong>at</strong>ional r<strong>at</strong>e and<br />
thus determines the regional effect <strong>of</strong> industry employment. <strong>The</strong> sum <strong>of</strong> these<br />
three effects equals the actual change in total employment within a region over a<br />
prescribed time period. When these sums are plotted on a graph with XY<br />
coordin<strong>at</strong>es, specific definitions th<strong>at</strong> balance local trends against n<strong>at</strong>ional trends<br />
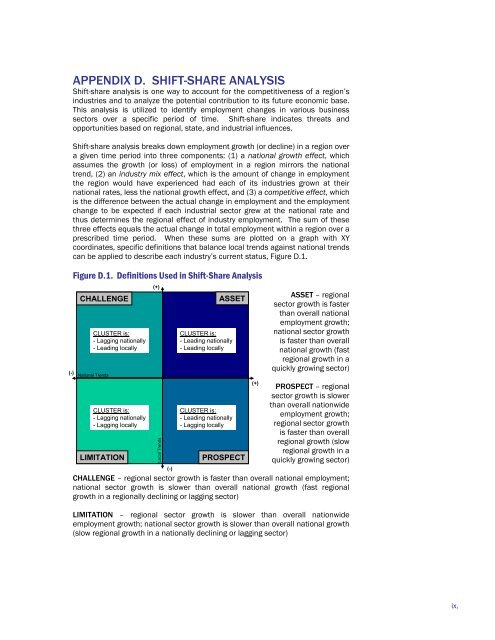
can be applied to describe each industry’s current st<strong>at</strong>us, Figure D.1.<br />
Figure D.1. Definitions Used in Shift-Share Analysis<br />
CHALLENGE<br />
(-) N<strong>at</strong>ional Trends<br />
CLUSTER is:<br />
- Lagging n<strong>at</strong>ionally<br />
- Leading locally<br />
CLUSTER is:<br />
- Lagging n<strong>at</strong>ionally<br />
- Lagging locally<br />
LIMITATION<br />
(+)<br />
Local Trends<br />
(-)<br />
ASSET<br />
CLUSTER is:<br />
- Leading n<strong>at</strong>ionally<br />
- Leading locally<br />
CLUSTER is:<br />
- Leading n<strong>at</strong>ionally<br />
- Lagging locally<br />
PROSPECT<br />
(+)<br />
ASSET – regional<br />
sector growth is faster<br />
than overall n<strong>at</strong>ional<br />
employment growth;<br />
n<strong>at</strong>ional sector growth<br />
is faster than overall<br />
n<strong>at</strong>ional growth (fast<br />
regional growth in a<br />
quickly growing sector)<br />
PROSPECT – regional<br />
sector growth is slower<br />
than overall n<strong>at</strong>ionwide<br />
employment growth;<br />
regional sector growth<br />
is faster than overall<br />
regional growth (slow<br />
regional growth in a<br />
quickly growing sector)<br />
CHALLENGE – regional sector growth is faster than overall n<strong>at</strong>ional employment;<br />
n<strong>at</strong>ional sector growth is slower than overall n<strong>at</strong>ional growth (fast regional<br />
growth in a regionally declining or lagging sector)<br />
LIMITATION – regional sector growth is slower than overall n<strong>at</strong>ionwide<br />
employment growth; n<strong>at</strong>ional sector growth is slower than overall n<strong>at</strong>ional growth<br />
(slow regional growth in a n<strong>at</strong>ionally declining or lagging sector)<br />
ix.