cameron county/matamoros - blue - The University of Texas at ...
cameron county/matamoros - blue - The University of Texas at ...
cameron county/matamoros - blue - The University of Texas at ...

You also want an ePaper? Increase the reach of your titles
YUMPU automatically turns print PDFs into web optimized ePapers that Google loves.
UTB-CBIRD Report: “At <strong>The</strong> Crossroads” Economic Development 105<br />
Cameron County wage and salary employment trends for the 1990s indic<strong>at</strong>e th<strong>at</strong><br />
its overall employment increased <strong>at</strong> a compounded annual r<strong>at</strong>e <strong>of</strong> 3.4%, making<br />
it the 28 th fastest growing metropolitan area in the n<strong>at</strong>ion. During the early part<br />
<strong>of</strong> the last decade, Cameron County enjoyed rapid employment growth thanks to<br />
the area’s booming manufacturing sector.<br />
In 1978, Cameron County’s manufacturing sector provided employment<br />
opportunities to nearly 20% <strong>of</strong> area workers in priv<strong>at</strong>e sector firms; however, by<br />
2000, th<strong>at</strong> share had fallen to just over 11%. After having gener<strong>at</strong>ed nearly<br />
2,000 manufacturing jobs between 1990 and 1994, Cameron County shed over<br />
1,000 manufacturing jobs by 2000, Figure 5.10. During this l<strong>at</strong>ter part <strong>of</strong> the<br />
decade, the local manufacturing sector posted job losses in all years, except<br />
2000. <strong>The</strong> majority <strong>of</strong> those losses appear to have been a result <strong>of</strong> heavy<br />
employment decreases in Textiles & Apparel, as both local and n<strong>at</strong>ional<br />
production has shifted to more inexpensive intern<strong>at</strong>ional labor markets. In short,<br />
Cameron County, like the st<strong>at</strong>e and n<strong>at</strong>ion, will become less dependent on a<br />
strong manufacturing sector for employment.<br />
Mexico: At the Crossroads<br />
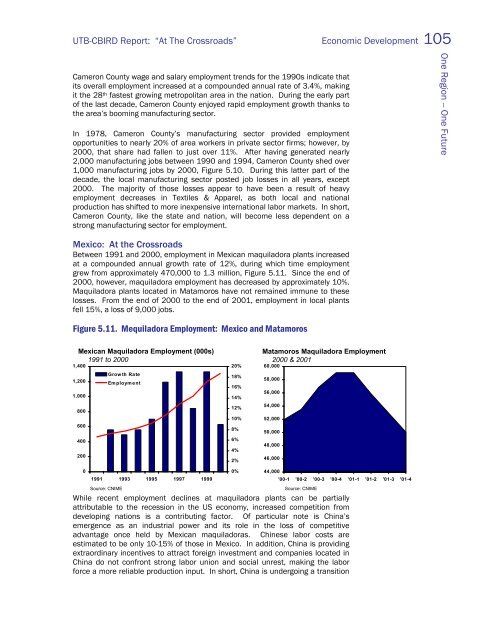
Between 1991 and 2000, employment in Mexican maquiladora plants increased<br />
<strong>at</strong> a compounded annual growth r<strong>at</strong>e <strong>of</strong> 12%, during which time employment<br />
grew from approxim<strong>at</strong>ely 470,000 to 1.3 million, Figure 5.11. Since the end <strong>of</strong><br />
2000, however, maquiladora employment has decreased by approxim<strong>at</strong>ely 10%.<br />
Maquiladora plants loc<strong>at</strong>ed in M<strong>at</strong>amoros have not remained immune to these<br />
losses. From the end <strong>of</strong> 2000 to the end <strong>of</strong> 2001, employment in local plants<br />
fell 15%, a loss <strong>of</strong> 9,000 jobs.<br />
Figure 5.11. Mequiladora Employment: Mexico and M<strong>at</strong>amoros<br />
Mexican Maquiladora Employment (000s)<br />
1991 to 2000<br />
1,400<br />
1,200<br />
1,000<br />
800<br />
600<br />
400<br />
200<br />
0<br />
1991 1993 1995 1997 1999<br />
Source: CNIME<br />
Grow th R<strong>at</strong>e<br />
Employment<br />
While recent employment declines <strong>at</strong> maquiladora plants can be partially<br />
<strong>at</strong>tributable to the recession in the US economy, increased competition from<br />
developing n<strong>at</strong>ions is a contributing factor. Of particular note is China’s<br />
emergence as an industrial power and its role in the loss <strong>of</strong> competitive<br />
advantage once held by Mexican maquiladoras. Chinese labor costs are<br />
estim<strong>at</strong>ed to be only 10-15% <strong>of</strong> those in Mexico. In addition, China is providing<br />
extraordinary incentives to <strong>at</strong>tract foreign investment and companies loc<strong>at</strong>ed in<br />
China do not confront strong labor union and social unrest, making the labor<br />
force a more reliable production input. In short, China is undergoing a transition<br />
20%<br />
18%<br />
16%<br />
14%<br />
12%<br />
10%<br />
8%<br />
6%<br />
4%<br />
2%<br />
0%<br />
M<strong>at</strong>amoros Maquiladora Employment<br />
2000 & 2001<br />
60,000<br />
58,000<br />
56,000<br />
54,000<br />
52,000<br />
50,000<br />
48,000<br />
46,000<br />
44,000<br />
'00-1 '00-2 '00-3 '00-4 '01-1 '01-2 '01-3 '01-4<br />
Source: CNIME<br />
One Region -- One Future