cameron county/matamoros - blue - The University of Texas at ...
cameron county/matamoros - blue - The University of Texas at ...
cameron county/matamoros - blue - The University of Texas at ...

You also want an ePaper? Increase the reach of your titles
YUMPU automatically turns print PDFs into web optimized ePapers that Google loves.
UTB-CBIRD Report: “At <strong>The</strong> Crossroads” Economic Development 125<br />
leads to gre<strong>at</strong>er incidence <strong>of</strong> hep<strong>at</strong>itis A and other illnesses. <strong>The</strong>se conditions<br />
are particularly onerous because they are associ<strong>at</strong>ed with limited access to<br />
tre<strong>at</strong>ment. In 1995, the <strong>Texas</strong> W<strong>at</strong>er Development Board estim<strong>at</strong>ed th<strong>at</strong><br />
340,000 <strong>Texas</strong> residents lived in colonias (Chapa and E<strong>at</strong>on, 1996). Within the<br />
LRGV most <strong>of</strong> the colonias are loc<strong>at</strong>ed in Cameron, Hidalgo, Webb, and Starr<br />
Counties. In short, because <strong>of</strong> inadequ<strong>at</strong>e w<strong>at</strong>er and sewage, colonia residents<br />
face many health hazards. <strong>The</strong>se are usually combined with strong barriers to<br />
accessing health prevention and care services. 1<br />
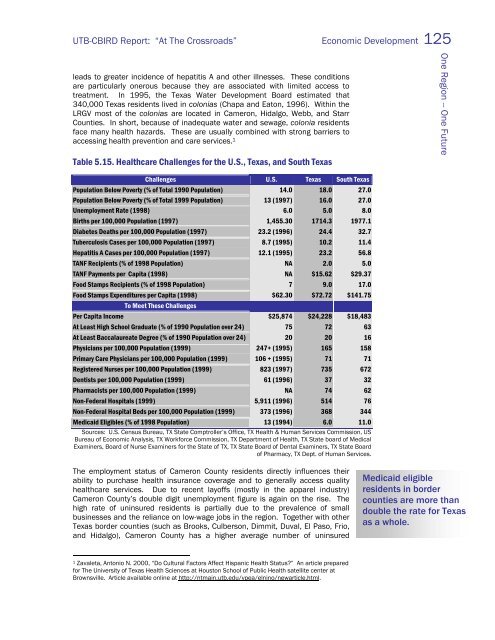
Table 5.15. Healthcare Challenges for the U.S., <strong>Texas</strong>, and South <strong>Texas</strong><br />
Challenges U.S. <strong>Texas</strong> South <strong>Texas</strong><br />
Popul<strong>at</strong>ion Below Poverty (% <strong>of</strong> Total 1990 Popul<strong>at</strong>ion) 14.0 18.0 27.0<br />
Popul<strong>at</strong>ion Below Poverty (% <strong>of</strong> Total 1999 Popul<strong>at</strong>ion) 13 (1997) 16.0 27.0<br />
Unemployment R<strong>at</strong>e (1998) 6.0 5.0 8.0<br />
Births per 100,000 Popul<strong>at</strong>ion (1997) 1,455.30 1714.3 1977.1<br />
Diabetes De<strong>at</strong>hs per 100,000 Popul<strong>at</strong>ion (1997) 23.2 (1996) 24.4 32.7<br />
Tuberculosis Cases per 100,000 Popul<strong>at</strong>ion (1997) 8.7 (1995) 10.2 11.4<br />
Hep<strong>at</strong>itis A Cases per 100,000 Popul<strong>at</strong>ion (1997) 12.1 (1995) 23.2 56.8<br />
TANF Recipients (% <strong>of</strong> 1998 Popul<strong>at</strong>ion) NA 2.0 5.0<br />
TANF Payments per Capita (1998) NA $15.62 $29.37<br />
Food Stamps Recipients (% <strong>of</strong> 1998 Popul<strong>at</strong>ion) 7 9.0 17.0<br />
Food Stamps Expenditures per Capita (1998) $62.30 $72.72 $141.75<br />
To Meet <strong>The</strong>se Challenges<br />
Per Capita Income $25,874 $24,228 $18,483<br />
At Least High School Gradu<strong>at</strong>e (% <strong>of</strong> 1990 Popul<strong>at</strong>ion over 24) 75 72 63<br />
At Least Baccalaure<strong>at</strong>e Degree (% <strong>of</strong> 1990 Popul<strong>at</strong>ion over 24) 20 20 16<br />
Physicians per 100,000 Popul<strong>at</strong>ion (1999) 247+ (1995) 165 158<br />
Primary Care Physicians per 100,000 Popul<strong>at</strong>ion (1999) 106 + (1995) 71 71<br />
Registered Nurses per 100,000 Popul<strong>at</strong>ion (1999) 823 (1997) 735 672<br />
Dentists per 100,000 Popul<strong>at</strong>ion (1999) 61 (1996) 37 32<br />
Pharmacists per 100,000 Popul<strong>at</strong>ion (1999) NA 74 62<br />
Non-Federal Hospitals (1999) 5,911 (1996) 514 76<br />
Non-Federal Hospital Beds per 100,000 Popul<strong>at</strong>ion (1999) 373 (1996) 368 344<br />
Medicaid Eligibles (% <strong>of</strong> 1998 Popul<strong>at</strong>ion) 13 (1994) 6.0 11.0<br />
Sources: U.S. Census Bureau, TX St<strong>at</strong>e Comptroller’s Office, TX Health & Human Services Commission, US<br />
Bureau <strong>of</strong> Economic Analysis, TX Workforce Commission, TX Department <strong>of</strong> Health, TX St<strong>at</strong>e board <strong>of</strong> Medical<br />
Examiners, Board <strong>of</strong> Nurse Examiners for the St<strong>at</strong>e <strong>of</strong> TX, TX St<strong>at</strong>e Board <strong>of</strong> Dental Examiners, TX St<strong>at</strong>e Board<br />
<strong>of</strong> Pharmacy, TX Dept. <strong>of</strong> Human Services.<br />
<strong>The</strong> employment st<strong>at</strong>us <strong>of</strong> Cameron County residents directly influences their<br />
ability to purchase health insurance coverage and to generally access quality<br />
healthcare services. Due to recent lay<strong>of</strong>fs (mostly in the apparel industry)<br />
Cameron County’s double digit unemployment figure is again on the rise. <strong>The</strong><br />
high r<strong>at</strong>e <strong>of</strong> uninsured residents is partially due to the prevalence <strong>of</strong> small<br />
businesses and the reliance on low-wage jobs in the region. Together with other<br />
<strong>Texas</strong> border counties (such as Brooks, Culberson, Dimmit, Duval, El Paso, Frio,<br />
and Hidalgo), Cameron County has a higher average number <strong>of</strong> uninsured<br />
1 Zavaleta, Antonio N. 2000, “Do Cultural Factors Affect Hispanic Health St<strong>at</strong>us?” An article prepared<br />
for <strong>The</strong> <strong>University</strong> <strong>of</strong> <strong>Texas</strong> Health Sciences <strong>at</strong> Houston School <strong>of</strong> Public Health s<strong>at</strong>ellite center <strong>at</strong><br />
Brownsville. Article available online <strong>at</strong> http://ntmain.utb.edu/vpea/elnino/newarticle.html.<br />
One Region -- One Future<br />
Medicaid eligible<br />
residents in border<br />
counties are more than<br />
double the r<strong>at</strong>e for <strong>Texas</strong><br />
as a whole.