10 Draft Integrated Waste Management Plan - City Council - City of ...
10 Draft Integrated Waste Management Plan - City Council - City of ...
10 Draft Integrated Waste Management Plan - City Council - City of ...

You also want an ePaper? Increase the reach of your titles
YUMPU automatically turns print PDFs into web optimized ePapers that Google loves.
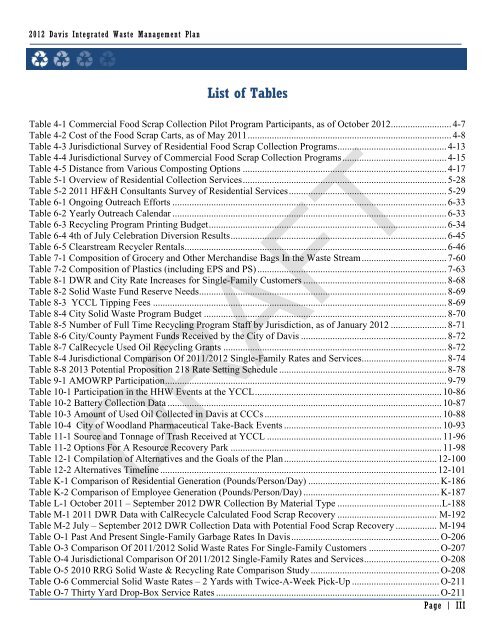
2012 Davis <strong>Integrated</strong> <strong>Waste</strong> <strong>Management</strong> <strong>Plan</strong><br />
List <strong>of</strong> Tables<br />
Table 4-1 Commercial Food Scrap Collection Pilot Program Participants, as <strong>of</strong> October 2012......................... 4-7<br />
Table 4-2 Cost <strong>of</strong> the Food Scrap Carts, as <strong>of</strong> May 2011 .................................................................................... 4-8<br />
Table 4-3 Jurisdictional Survey <strong>of</strong> Residential Food Scrap Collection Programs ............................................. 4-13<br />
Table 4-4 Jurisdictional Survey <strong>of</strong> Commercial Food Scrap Collection Programs ........................................... 4-15<br />
Table 4-5 Distance from Various Composting Options .................................................................................... 4-17<br />
Table 5-1 Overview <strong>of</strong> Residential Collection Services .................................................................................... 5-28<br />
Table 5-2 2011 HF&H Consultants Survey <strong>of</strong> Residential Services ................................................................. 5-29<br />
Table 6-1 Ongoing Outreach Efforts ................................................................................................................. 6-33<br />
Table 6-2 Yearly Outreach Calendar ................................................................................................................. 6-33<br />
Table 6-3 Recycling Program Printing Budget .................................................................................................. 6-34<br />
Table 6-4 4th <strong>of</strong> July Celebration Diversion Results ......................................................................................... 6-45<br />
Table 6-5 Clearstream Recycler Rentals............................................................................................................ 6-46<br />
Table 7-1 Composition <strong>of</strong> Grocery and Other Merchandise Bags In the <strong>Waste</strong> Stream ................................... 7-60<br />
Table 7-2 Composition <strong>of</strong> Plastics (including EPS and PS) .............................................................................. 7-63<br />
Table 8-1 DWR and <strong>City</strong> Rate Increases for Single-Family Customers ........................................................... 8-68<br />
Table 8-2 Solid <strong>Waste</strong> Fund Reserve Needs...................................................................................................... 8-69<br />
Table 8-3 YCCL Tipping Fees ......................................................................................................................... 8-69<br />
Table 8-4 <strong>City</strong> Solid <strong>Waste</strong> Program Budget .................................................................................................... 8-70<br />
Table 8-5 Number <strong>of</strong> Full Time Recycling Program Staff by Jurisdiction, as <strong>of</strong> January 2012 ....................... 8-71<br />
Table 8-6 <strong>City</strong>/County Payment Funds Received by the <strong>City</strong> <strong>of</strong> Davis ............................................................ 8-72<br />
Table 8-7 CalRecycle Used Oil Recycling Grants ............................................................................................ 8-72<br />
Table 8-4 Jurisdictional Comparison Of 2011/2012 Single-Family Rates and Services................................... 8-74<br />
Table 8-8 2013 Potential Proposition 218 Rate Setting Schedule ..................................................................... 8-78<br />
Table 9-1 AMOWRP Participation .................................................................................................................... 9-79<br />
Table <strong>10</strong>-1 Participation in the HHW Events at the YCCL ............................................................................. <strong>10</strong>-86<br />
Table <strong>10</strong>-2 Battery Collection Data ................................................................................................................. <strong>10</strong>-87<br />
Table <strong>10</strong>-3 Amount <strong>of</strong> Used Oil Collected in Davis at CCCs ......................................................................... <strong>10</strong>-88<br />
Table <strong>10</strong>-4 <strong>City</strong> <strong>of</strong> Woodland Pharmaceutical Take-Back Events ................................................................. <strong>10</strong>-93<br />
Table 11-1 Source and Tonnage <strong>of</strong> Trash Received at YCCL ........................................................................ 11-96<br />
Table 11-2 Options For A Resource Recovery Park ....................................................................................... 11-98<br />
Table 12-1 Compilation <strong>of</strong> Alternatives and the Goals <strong>of</strong> the <strong>Plan</strong> ............................................................... 12-<strong>10</strong>0<br />
Table 12-2 Alternatives Timeline .................................................................................................................. 12-<strong>10</strong>1<br />
Table K-1 Comparison <strong>of</strong> Residential Generation (Pounds/Person/Day) ...................................................... K-186<br />
Table K-2 Comparison <strong>of</strong> Employee Generation (Pounds/Person/Day) ........................................................ K-187<br />
Table L-1 October 2011 – September 2012 DWR Collection By Material Type ........................................... L-188<br />
Table M-1 2011 DWR Data with CalRecycle Calculated Food Scrap Recovery ......................................... M-192<br />
Table M-2 July – September 2012 DWR Collection Data with Potential Food Scrap Recovery ................. M-194<br />
Table O-1 Past And Present Single-Family Garbage Rates In Davis ............................................................. O-206<br />
Table O-3 Comparison Of 2011/2012 Solid <strong>Waste</strong> Rates For Single-Family Customers ............................. O-207<br />
Table O-4 Jurisdictional Comparison Of 2011/2012 Single-Family Rates and Services ............................... O-208<br />
Table O-5 20<strong>10</strong> RRG Solid <strong>Waste</strong> & Recycling Rate Comparison Study ..................................................... O-208<br />
Table O-6 Commercial Solid <strong>Waste</strong> Rates – 2 Yards with Twice-A-Week Pick-Up .................................... O-211<br />
Table O-7 Thirty Yard Drop-Box Service Rates ............................................................................................ O-211<br />
Page | III<br />
DRAFT