10 Draft Integrated Waste Management Plan - City Council - City of ...
10 Draft Integrated Waste Management Plan - City Council - City of ...
10 Draft Integrated Waste Management Plan - City Council - City of ...

Create successful ePaper yourself
Turn your PDF publications into a flip-book with our unique Google optimized e-Paper software.
2012 Davis <strong>Integrated</strong> <strong>Waste</strong> <strong>Management</strong> <strong>Plan</strong><br />
Direct mail to residential customers for cart pre-order—October 2013<br />
New rates go into effect—December 1, 2013<br />
DWR begins to deliver carts—October 2013<br />
One challenge with a variable can rate, as mentioned above, is that it can increase the contamination rates in<br />
recycling and composting carts. Some cities experienced a spike in contamination <strong>of</strong> their recycling stream once<br />
a variable can rate is introduced. San Jose went from a 5% contamination rate to about 30% contamination<br />
when they switched to cart service. Alternatively, San Diego has 96 gallon cart service for garbage, recycling<br />
and yard waste and has less than 5% contamination in the recycling carts.<br />
An alternative to the standard variable can rate schedule is a case rate schedule, where residents are charged a<br />
base service rate that covers administration costs, program costs, and the cost to have the solid waste trucks stop<br />
at each house. Additional rates are added for recycling, compost and trash disposal/processing services. This<br />
type <strong>of</strong> rate structure also avoids one <strong>of</strong> the major pitfalls <strong>of</strong> variable can rate systems—loss <strong>of</strong> revenue source.<br />
With solid waste rates based solely on how much trash a resident throws away, in theory residents could<br />
diverting so much material away from the garbage that there is no longer enough revenue collected to pay for<br />
the recycling and composting <strong>of</strong> the other wastes. By ensuring that all collection streams are budgeted for in the<br />
rate system, this is not a problem. It is also an equitable system—those with more trash, pay more for trash<br />
service. Residents that have more recyclables pay for more recycling service, etc. Residents that reduce waste<br />
and compost their own materials are rewarded by lower service rates. See Appendix T and U for alternative<br />
rate structures.<br />
8.3<br />
Projected Solid <strong>Waste</strong> Rates<br />
Solid waste rates are based on CPI adjustments to DWR and YCCL tipping fees. The CPI adjustment is based<br />
on fuel and transportation costs, while the YCCL tipping fees is based on landfill operational costs. The chart<br />
below shows a base rate projection assuming a 3% annual increase, actual rates will be based on deviation base<br />
rate assumptions and <strong>City</strong> policy decisions that could affect the future rates. Future rate risk factors include<br />
high inflation rates and the State increasing fees that impact local solid waste costs and rates.<br />
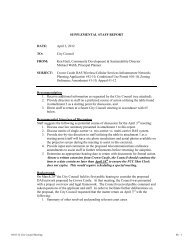
FIGURE 8-3 PROJECTED MONTHLY SINGLE-FAMILY SOLID WASTE RATES THROUGH 2020<br />
$40.00<br />
$35.00<br />
$30.00<br />
$25.00<br />
$20.00<br />
$15.00<br />
$<strong>10</strong>.00<br />
$5.00<br />
$0.00<br />
DRAFT<br />
Page | 8-76