- Page 3 and 4:
SANCTIONING APARTHEID Edited by Rob
- Page 5 and 6:
Introduction Robert Edgar CONTENTS
- Page 7:
South Afrimn Sanctions Breaking in
- Page 10 and 11:
a1 Center for Dedopment Poli~y; Lut
- Page 12 and 13:
2 Directing the Export-Import Bank
- Page 14 and 15:
sources are identified or tapped. A
- Page 16 and 17:
South Africa's credit rating and it
- Page 18 and 19:
system and Conpzsional dissatisfact
- Page 20 and 21:
Works, Ways and M-, Interior, and E
- Page 22 and 23:
12 Sanctioning Apartheid The diffic
- Page 24 and 25:
through Swadmd and take advantage o
- Page 26 and 27:
Despite the mounting evidence that
- Page 29 and 30:
IMFLEMENTATION OF THE A m- APARTHEI
- Page 31 and 32:
Implementah of the Anfi-Apartheid A
- Page 33 and 34:
Implementation of the Anti-Aparthei
- Page 35 and 36:
Implementatiotl of the Anti-AprfM R
- Page 37 and 38:
Implementation ~f the Anti-Aparthei
- Page 39 and 40:
Emplementation of the Anti-Aparthei
- Page 41 and 42:
Implemenkrtion of the Anti-Aparthei
- Page 43 and 44:
ntpiementation of the Anti-Aparthei
- Page 45 and 46:
Implementation of the Anti-Aphid Ac
- Page 47 and 48:
Imp&- I m p l m h of the An ti-Apar
- Page 49 and 50:
Implmtafion of the Anti-AprChejd Ac
- Page 51 and 52:
hqlmfatibn of fhe AnfrLAphid Act of
- Page 53 and 54:
Implementation of the Anti-Aparthei
- Page 55 and 56:
Imphtafion of the Anki-A+ Ad of 198
- Page 57 and 58:
Implan~1Wh of the Anti-Apartheid Ac
- Page 59 and 60:
1- of the Anti-ApaW Ad of 1986 4. L
- Page 61 and 62:
Implmfrxliotr of fhe Anti-Apartheid
- Page 63 and 64:
ImplmtnU of the Anti-Apmiheid Act o
- Page 65 and 66:
Implementation of the Anti-Aparthei
- Page 67 and 68:
THE SOUTH AFRICA-ISKAEL ALLIANCE, 1
- Page 69 and 70:
The South Af&~-heI Anh8 1986-1988 5
- Page 71 and 72:
The South Afrr'ci-Israel Alliance,
- Page 73 and 74:
coIlaboration. The total Israeli co
- Page 75 and 76:
The South Aftrca-Israel Alliance, 1
- Page 77 and 78:
SANCTIONS, DISINVESTMENT, AND US CO
- Page 79 and 80:
S m h , Disimtment, and US Corpmnti
- Page 81 and 82:
S a m J Disirmestmmt, and US Corpor
- Page 83 and 84:
Sancfions, Disimestment, and US Cor
- Page 85 and 86:
S m h , Disimtmt, and US Corpmation
- Page 87 and 88:
Sanctions, Disim)mwtt, and US Gnpmf
- Page 89 and 90:
Sanctions, Disinvesfmnt, and US Cor
- Page 91 and 92:
Sutrcfions, Disimiment, and US Gorp
- Page 93 and 94:
Sanctions, Disimstment, and US Gqwr
- Page 95 and 96:
emoved the immediate pressure on So
- Page 97 and 98:
Sanctions, Disinvestment, and US Co
- Page 99:
Su-# Disimbt, nnd US Corpemtiolns r
- Page 102 and 103:
92 Sanctioning Apartheid to disinve
- Page 104 and 105:
elevance: people were asked directl
- Page 106 and 107:
0nehaSwa~thefierp~geandhDstilea~tud
- Page 108 and 109:
had suffered psychoIogically). "The
- Page 110 and 111:
ment would amount to a dosing d m o
- Page 112 and 113:
ut at the same time it is isdemhhg
- Page 114 and 115:
Sanctionkg Apartheid military optio
- Page 116 and 117:
Sanctioning Apartheid Asikpd: 64; N
- Page 118:
and to feel that it has brought ver
- Page 122 and 123:
affechg business confidence in that
- Page 124 and 125:
abes have chopped to just over 12%
- Page 127 and 128:
17re Impact of New Sanctions agains
- Page 129 and 130:
The Impact of New Sanctions againsf
- Page 131 and 132:
7Ice Impncf of New Sandions agninsl
- Page 133 and 134:
The Impd of Nao Smh'm against South
- Page 135 and 136:
The Impact of Neut Sanctions agains
- Page 137 and 138:
The Iftff~ct of Nau Sanctions again
- Page 139 and 140:
The Impncf of New Sanctions against
- Page 141 and 142:
The Inrpf of New Sancriens against
- Page 143 and 144:
The Impact of New Sanctions against
- Page 145 and 146:
The Imp& of New bctions against Sou
- Page 147 and 148:
The Imp3 of Near Sunclions against
- Page 149:
The I mpd of Neut Sandimrs against
- Page 152 and 153:
more, as Randall Robin emphaswd, if
- Page 154 and 155:
Table 1 Sales of US affiliatd opera
- Page 156 and 157:
paid jobs nor landg Forced removals
- Page 158 and 159:
Table 2 Major United Statea Expmbj
- Page 160 and 161:
Bo- ktho, and Swaziland all depiwld
- Page 162 and 163:
manufa- iglports they require from
- Page 164 and 165:
154 Sanctioning Aprrfheid Sanctiom
- Page 166 and 167:
Scraps of evidence suggest that in
- Page 168 and 169:
earned in an hour. Dekdhe work is n
- Page 170 and 171:
Sanctioning Apaftheid 3. "rum Up He
- Page 172 and 173:
27. Aqglo had prmhdy aq&d a growing
- Page 175 and 176:
THE OIL EMBARGO AGAINST' SOUTH AFRI
- Page 177 and 178:
The Oil Embargo against South qFica
- Page 179 and 180:
The Oil Embargo ugargarmt South A m
- Page 181 and 182:
egulations, the oil companies remai
- Page 183 and 184:
ite Oil Embnrgo agargarnst South AJ
- Page 185 and 186:
The Oil Embargo againsf South Afric
- Page 187 and 188: 7?ze Oil Embnsgo ap'ns5 Solrth Afri
- Page 189 and 190: The Oil Embargo against South Afric
- Page 191 and 192: HIGH-TECH SANCTIONS: MORE BARK THAN
- Page 193 and 194: High-Tech Samtiotxs exported by Ame
- Page 195 and 196: High-Tech Smctbns African high-tech
- Page 197 and 198: High-Tech Sanctions 187 Case One: U
- Page 199 and 200: High-Tech Sanctions There are numem
- Page 201 and 202: High-Tech Sancfions the restriction
- Page 203: High-Tach Sanctions 19. m d o r a i
- Page 206 and 207: Sanctioning Apartheid wages average
- Page 208 and 209: Sanctioning Apmtheid to smuggle its
- Page 210 and 211: Sanctioning Apartheid The ban would
- Page 212 and 213: 2 The gold market could well profit
- Page 214 and 215: 204 Sanctioning Apartheid The finan
- Page 216 and 217: 206 Sanctioning Apartheid are the s
- Page 218 and 219: Sanctioning Apartheid high gold pri
- Page 221 and 222: SANCTIONS AND FINANCING SOUTH AFRIC
- Page 223 and 224: Snncfions and Financing South Afric
- Page 225 and 226: Sanctions and Fim'ng South AAfrr's
- Page 227 and 228: Sanctions and Financing South AFjcn
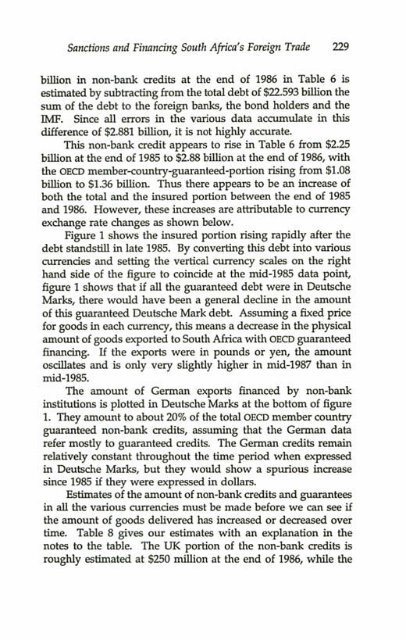
- Page 229 and 230: SamW and Finnncing South Africu's F
- Page 231 and 232: Sanctiotrs and Financing South Afn'
- Page 233 and 234: Sanctions and Financing South Afrim
- Page 235 and 236: SIIlrntions and FWng South Afn'm's
- Page 237: Sanctions and Financing South Afrrc
- Page 241 and 242: Sanetiam and Finam'ng South Africa'
- Page 243 and 244: Sanctias and Financing South Africa
- Page 245 and 246: Samfiom and Financing South Africa'
- Page 247 and 248: Sawlions and Financing South Africa
- Page 249 and 250: SamW and Financing South Afim's For
- Page 251: Smrdions and Financing South Afica'
- Page 254 and 255: Sanctioning Aprfheid This threat wa
- Page 256 and 257: 246 Sanctioning Apartheid and many
- Page 258 and 259: Table 2 1986 Platinum Imports I-*8
- Page 260 and 261: Notes a. Bureau of Mines, Prqnint f
- Page 262 and 263: 252 Sanctioning Apartheid on vanadi
- Page 264 and 265: 9. ~ u o f ~ , ~ ~ ~ l 9 8 6 B u n
- Page 266 and 267: the w d cmmunity. How the Frontline
- Page 268 and 269: 258 Sanctioning Apartheid and gener
- Page 270 and 271: 260 Sanctioning Apartheid The optim
- Page 272 and 273: 262 Sanctioning Apartheid Contingen
- Page 274 and 275: the podbility of a sudden clamre of
- Page 276 and 277: 266 Sanctioning Aparfheid launched
- Page 278 and 279: dwkicms percolatd to the public alm
- Page 280 and 281: y diverfing their London Bights thr
- Page 282 and 283: 272 Snnching Apartheid humiljating
- Page 284 and 285: his &camfort. Accordingly, on 21 Ju
- Page 286 and 287: 276 Sanctioning Apartheid which the
- Page 288 and 289:
Sanctioning Apartheid Of immediate
- Page 290 and 291:
280 Sanctioning Apartheid &M Botswa
- Page 292 and 293:
azmmmity on the question of Namibia
- Page 294 and 295:
22, Colin "Ma FrontIine Sbabes get
- Page 296 and 297:
Assbme to Fronthe Stafes had been a
- Page 298 and 299:
47. TimesI 28 July lWI 7. Following
- Page 300 and 301:
Table 1 Zimbabtw Znrnbia Six LundhM
- Page 302 and 303:
78. Hanlon, Btggm Ym Neighhum* 75,m
- Page 304 and 305:
Given that fact, a primary corn is
- Page 306 and 307:
developmgnt of Southern Rhodesia, A
- Page 308 and 309:
298 Sanctioning Apmthd involved in
- Page 310 and 311:
ed to the integrity of the South Af
- Page 312 and 313:
Sanctioning Apartheid creates a nat
- Page 314 and 315:
in 19815 to UA%9,127,OQO in 1984 an
- Page 316 and 317:
3[P6 Sancfwning Apartheid flying to
- Page 318 and 319:
Msnegi wa Dikgang/The Reporter put
- Page 320 and 321:
310 Smctiuning Apartheid at least i
- Page 322 and 323:
312 Sanctioning Aprrtheid criticism
- Page 324 and 325:
314 Sanctioning Aparfheid the South
- Page 326 and 327:
Sanctioning Apartheid would probabl
- Page 328 and 329:
Sntlcfioning Apartheid to the anti-
- Page 330 and 331:
Sanctioning Apartheid 9. See the di
- Page 333 and 334:
SOUTH AFRICAN SANCTIONS BREAKING IN
- Page 335 and 336:
south Afrwm Smrctim Ereding in S ou
- Page 337 and 338:
South Afrimn Sanctions Braking in S
- Page 339 and 340:
South Afnam Sanctions Braaking in S
- Page 341 and 342:
South Afncan Sanctions Braking in S
- Page 343 and 344:
South Afncan Sanctions Braking in S
- Page 345 and 346:
South African Smictions Breaking in
- Page 347 and 348:
Soufh African Sanctions Breaking in
- Page 349 and 350:
SANCTIONS AGAINST SOUTH AFRICA: LES
- Page 351 and 352:
Sanctias against Soufh Africa: Leso
- Page 353 and 354:
Sanctions against South Africa: LPs
- Page 355 and 356:
Sanctions against South Africa: Les
- Page 357 and 358:
SanctiDns againsf South Africa: Les
- Page 359 and 360:
Sanctions against South Afn'cn: Les
- Page 361 and 362:
Sanctions against South Africa: Les
- Page 363 and 364:
Sanctions against South Africa: Les
- Page 365:
Sanctions against South Africa: Les
- Page 368 and 369:
358 Sanctioning Apartheid policy ob
- Page 370 and 371:
Such success gives the lie to South
- Page 372 and 373:
Sanctioning Apartheid Prime Ministe
- Page 374 and 375:
-tm ! ts71n2 t t ~ ~ p d I W S ~ 1
- Page 376 and 377:
366 Sanctioning Apartheid biggest c
- Page 378 and 379:
368 Sanctioning Apartheid and Beia
- Page 380 and 381:
370 Sanctioning Apartheid tend to b
- Page 382 and 383:
Sanctioning ApartM ing the dependen
- Page 384 and 385:
suffering from drought, economic co
- Page 386 and 387:
376 Smtiming Apartheid to attempt t
- Page 388 and 389:
Sanctioning Rpmfheid 10. The market
- Page 391 and 392:
TPI[E CLJLTLWiL BOYCOTT OF SOUTH AF
- Page 393 and 394:
The Cultural Boycott 4 Smith Africa
- Page 395 and 396:
TSlt Cuftuml Boyco f f of Sou fh Af
- Page 397 and 398:
The Cultuml Bqm# of Soufh Afrim EIE
- Page 399 and 400:
The Cultural Boycott of South Afrun
- Page 401 and 402:
The Cullural Bqywtf of South Aj%a (
- Page 403 and 404:
The Cultural Boycott of South Afrim
- Page 405 and 406:
The Cultural Boycuff of South Afric
- Page 407 and 408:
THE CULTUWiL BOYCOTT OF SOUTH AFRIC
- Page 409 and 410:
The Cultural Boycott of South Afric
- Page 411 and 412:
llre Cultufal Bpywff of South AfPia
- Page 413 and 414:
The Cdlural Bqmtt of South Afrim 1I
- Page 415 and 416:
The Culbral Baycoff of South Afriut
- Page 417 and 418:
The Cultural Boym# of Soufh A W III
- Page 419 and 420:
The Culhrral Boycatf of South Afric
- Page 421 and 422:
The CdWl Boycott of South Africn (I
- Page 423 and 424:
EDITOR Robert Edgar is hwdate Profe
- Page 425 and 426:
John Lind is the amutive director o
- Page 427:
Pe$e's Rights in m Unjust World: fh
- Page 430 and 431:
hswiation of Westem Europ an Parlia
- Page 432 and 433:
US companiesS 77-79,183 90 Confedem
- Page 434 and 435:
smuggling 19648,200, 2D6W SOUXIZ 1W
- Page 436 and 437:
Sanctioning Apartheid Letsie, Skl-m
- Page 438 and 439:
Olympic Ahways 287 Oman 174 Ontd I8
- Page 440 and 441:
oil 16678 ~ t a ] CsGeMViduaE s nam
- Page 442 and 443:
uranitlm 178 US d m l@htion 10-1 1


![Synthèse [6] DEFALL..INSTRAW.pdf - Matrix](https://img.yumpu.com/17880734/1/190x245/synthese-6-defallinstrawpdf-matrix.jpg?quality=85)