Why Bad Presentations Happen to Good Causes - The Goodman ...
Why Bad Presentations Happen to Good Causes - The Goodman ...
Why Bad Presentations Happen to Good Causes - The Goodman ...

You also want an ePaper? Increase the reach of your titles
YUMPU automatically turns print PDFs into web optimized ePapers that Google loves.
pg. 80<br />
Appendix<br />
Survey Methodology and Results – cont’d<br />
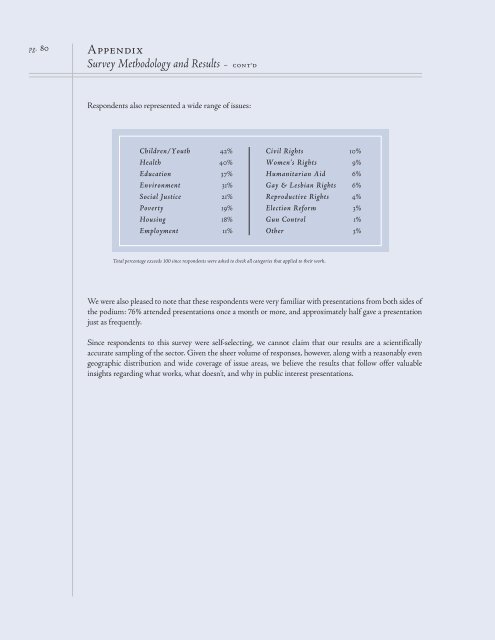
Respondents also represented a wide range of issues:<br />
Children/Youth 42%<br />
Health 40%<br />
Education 37%<br />
Environment 31%<br />
Social Justice 21%<br />
Poverty 19%<br />
Housing 18%<br />
Employment 11%<br />
Civil Rights 10%<br />
Women's Rights 9%<br />
Humanitarian Aid 6%<br />
Gay & Lesbian Rights 6%<br />
Reproductive Rights 4%<br />
Election Reform 3%<br />
Gun Control 1%<br />
Other 3%<br />
Total percentage exceeds 100 since respondents were asked <strong>to</strong> check all categories that applied <strong>to</strong> their work.<br />
We were also pleased <strong>to</strong> note that these respondents were very familiar with presentations from both sides of<br />
the podium: 76% attended presentations once a month or more, and approximately half gave a presentation<br />
just as frequently.<br />
Since respondents <strong>to</strong> this survey were self-selecting, we cannot claim that our results are a scientifically<br />
accurate sampling of the sec<strong>to</strong>r. Given the sheer volume of responses, however, along with a reasonably even<br />
geographic distribution and wide coverage of issue areas, we believe the results that follow offer valuable<br />
insights regarding what works, what doesn’t, and why in public interest presentations.