Final report - Integrated Land Management Bureau
Final report - Integrated Land Management Bureau
Final report - Integrated Land Management Bureau

Create successful ePaper yourself
Turn your PDF publications into a flip-book with our unique Google optimized e-Paper software.
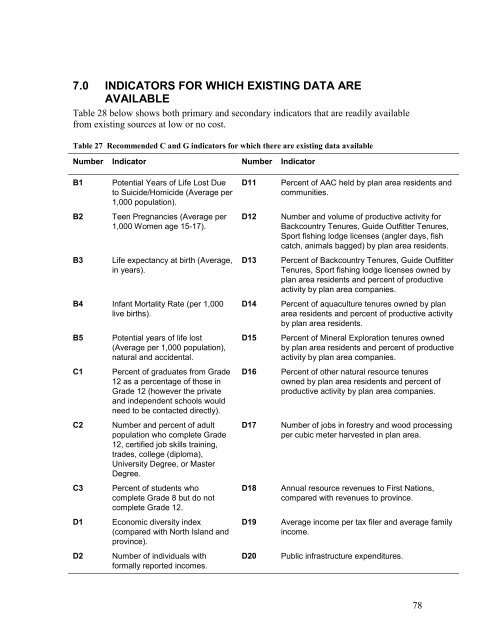
7.0 INDICATORS FOR WHICH EXISTING DATA ARE<br />
AVAILABLE<br />
Table 28 below shows both primary and secondary indicators that are readily available<br />
from existing sources at low or no cost.<br />
Table 27 Recommended C and G indicators for which there are existing data available<br />
Number Indicator Number Indicator<br />
B1 Potential Years of Life Lost Due<br />
to Suicide/Homicide (Average per<br />
1,000 population).<br />
B2 Teen Pregnancies (Average per<br />
1,000 Women age 15-17).<br />
B3 Life expectancy at birth (Average,<br />
in years).<br />
B4 Infant Mortality Rate (per 1,000<br />
live births).<br />
B5 Potential years of life lost<br />
(Average per 1,000 population),<br />
natural and accidental.<br />
C1 Percent of graduates from Grade<br />
12 as a percentage of those in<br />
Grade 12 (however the private<br />
and independent schools would<br />
need to be contacted directly).<br />
C2 Number and percent of adult<br />
population who complete Grade<br />
12, certified job skills training,<br />
trades, college (diploma),<br />
University Degree, or Master<br />
Degree.<br />
C3 Percent of students who<br />
complete Grade 8 but do not<br />
complete Grade 12.<br />
D1 Economic diversity index<br />
(compared with North Island and<br />
province).<br />
D2 Number of individuals with<br />
formally <strong>report</strong>ed incomes.<br />
D11 Percent of AAC held by plan area residents and<br />
communities.<br />
D12 Number and volume of productive activity for<br />
Backcountry Tenures, Guide Outfitter Tenures,<br />
Sport fishing lodge licenses (angler days, fish<br />
catch, animals bagged) by plan area residents.<br />
D13 Percent of Backcountry Tenures, Guide Outfitter<br />
Tenures, Sport fishing lodge licenses owned by<br />
plan area residents and percent of productive<br />
activity by plan area companies.<br />
D14 Percent of aquaculture tenures owned by plan<br />
area residents and percent of productive activity<br />
by plan area residents.<br />
D15 Percent of Mineral Exploration tenures owned<br />
by plan area residents and percent of productive<br />
activity by plan area companies.<br />
D16 Percent of other natural resource tenures<br />
owned by plan area residents and percent of<br />
productive activity by plan area companies.<br />
D17 Number of jobs in forestry and wood processing<br />
per cubic meter harvested in plan area.<br />
D18 Annual resource revenues to First Nations,<br />
compared with revenues to province.<br />
D19 Average income per tax filer and average family<br />
income.<br />
D20 Public infrastructure expenditures.<br />
78