Final report - Integrated Land Management Bureau
Final report - Integrated Land Management Bureau
Final report - Integrated Land Management Bureau

You also want an ePaper? Increase the reach of your titles
YUMPU automatically turns print PDFs into web optimized ePapers that Google loves.
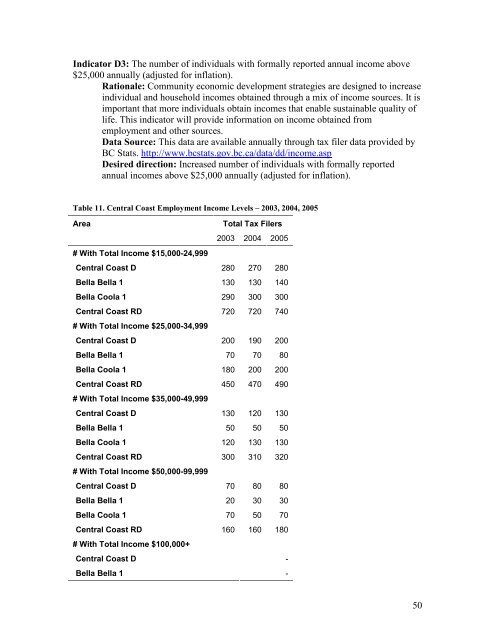
Indicator D3: The number of individuals with formally <strong>report</strong>ed annual income above<br />
$25,000 annually (adjusted for inflation).<br />
Rationale: Community economic development strategies are designed to increase<br />
individual and household incomes obtained through a mix of income sources. It is<br />
important that more individuals obtain incomes that enable sustainable quality of<br />
life. This indicator will provide information on income obtained from<br />
employment and other sources.<br />
Data Source: This data are available annually through tax filer data provided by<br />
BC Stats. http://www.bcstats.gov.bc.ca/data/dd/income.asp<br />
Desired direction: Increased number of individuals with formally <strong>report</strong>ed<br />
annual incomes above $25,000 annually (adjusted for inflation).<br />
Table 11. Central Coast Employment Income Levels – 2003, 2004, 2005<br />
Area Total Tax Filers<br />
# With Total Income $15,000-24,999<br />
2003 2004 2005<br />
Central Coast D 280 270 280<br />
Bella Bella 1 130 130 140<br />
Bella Coola 1 290 300 300<br />
Central Coast RD 720 720 740<br />
# With Total Income $25,000-34,999<br />
Central Coast D 200 190 200<br />
Bella Bella 1 70 70 80<br />
Bella Coola 1 180 200 200<br />
Central Coast RD 450 470 490<br />
# With Total Income $35,000-49,999<br />
Central Coast D 130 120 130<br />
Bella Bella 1 50 50 50<br />
Bella Coola 1 120 130 130<br />
Central Coast RD 300 310 320<br />
# With Total Income $50,000-99,999<br />
Central Coast D 70 80 80<br />
Bella Bella 1 20 30 30<br />
Bella Coola 1 70 50 70<br />
Central Coast RD 160 160 180<br />
# With Total Income $100,000+<br />
Central Coast D -<br />
Bella Bella 1 -<br />
50