Final report - Integrated Land Management Bureau
Final report - Integrated Land Management Bureau
Final report - Integrated Land Management Bureau

You also want an ePaper? Increase the reach of your titles
YUMPU automatically turns print PDFs into web optimized ePapers that Google loves.
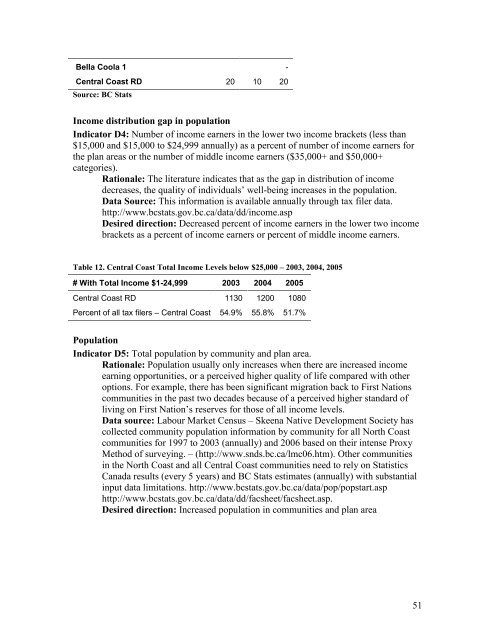
Bella Coola 1 -<br />
Central Coast RD 20 10 20<br />
Source: BC Stats<br />
Income distribution gap in population<br />
Indicator D4: Number of income earners in the lower two income brackets (less than<br />
$15,000 and $15,000 to $24,999 annually) as a percent of number of income earners for<br />
the plan areas or the number of middle income earners ($35,000+ and $50,000+<br />
categories).<br />
Rationale: The literature indicates that as the gap in distribution of income<br />
decreases, the quality of individuals’ well-being increases in the population.<br />
Data Source: This information is available annually through tax filer data.<br />
http://www.bcstats.gov.bc.ca/data/dd/income.asp<br />
Desired direction: Decreased percent of income earners in the lower two income<br />
brackets as a percent of income earners or percent of middle income earners.<br />
Table 12. Central Coast Total Income Levels below $25,000 – 2003, 2004, 2005<br />
# With Total Income $1-24,999 2003 2004 2005<br />
Central Coast RD 1130 1200 1080<br />
Percent of all tax filers – Central Coast 54.9% 55.8% 51.7%<br />
Population<br />
Indicator D5: Total population by community and plan area.<br />
Rationale: Population usually only increases when there are increased income<br />
earning opportunities, or a perceived higher quality of life compared with other<br />
options. For example, there has been significant migration back to First Nations<br />
communities in the past two decades because of a perceived higher standard of<br />
living on First Nation’s reserves for those of all income levels.<br />
Data source: Labour Market Census – Skeena Native Development Society has<br />
collected community population information by community for all North Coast<br />
communities for 1997 to 2003 (annually) and 2006 based on their intense Proxy<br />
Method of surveying. – (http://www.snds.bc.ca/lmc06.htm). Other communities<br />
in the North Coast and all Central Coast communities need to rely on Statistics<br />
Canada results (every 5 years) and BC Stats estimates (annually) with substantial<br />
input data limitations. http://www.bcstats.gov.bc.ca/data/pop/popstart.asp<br />
http://www.bcstats.gov.bc.ca/data/dd/facsheet/facsheet.asp.<br />
Desired direction: Increased population in communities and plan area<br />
51